Unlock a world of possibilities! Login now and discover the exclusive benefits awaiting you.
- Qlik Community
- :
- All Forums
- :
- QlikView App Dev
- :
- Scatter Chart: Rescale Bubble Size
- Subscribe to RSS Feed
- Mark Topic as New
- Mark Topic as Read
- Float this Topic for Current User
- Bookmark
- Subscribe
- Mute
- Printer Friendly Page
- Mark as New
- Bookmark
- Subscribe
- Mute
- Subscribe to RSS Feed
- Permalink
- Report Inappropriate Content
Scatter Chart: Rescale Bubble Size
Hello,
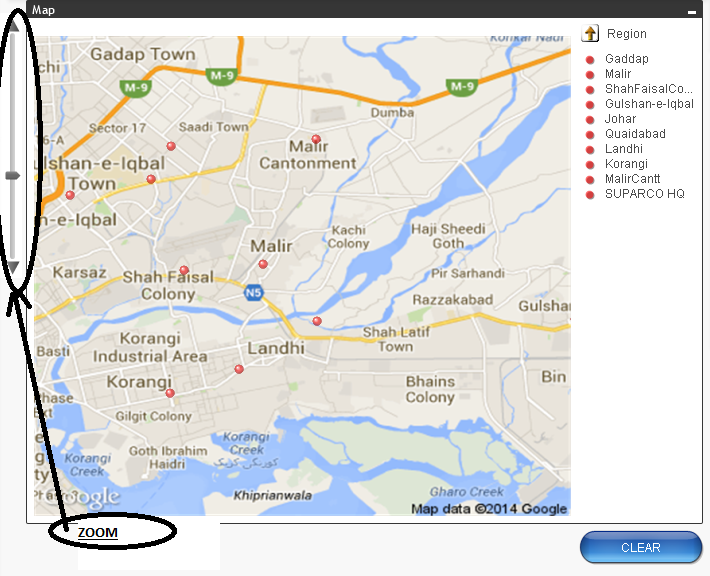
I have the following map on my application as a Scatter Chart, with a longitude and a latitude (please see QVW attached).
There's also a Zoom on the left (with a Slider using a variable var_zoom) that allows me to make a zoom over the map to see it closer:

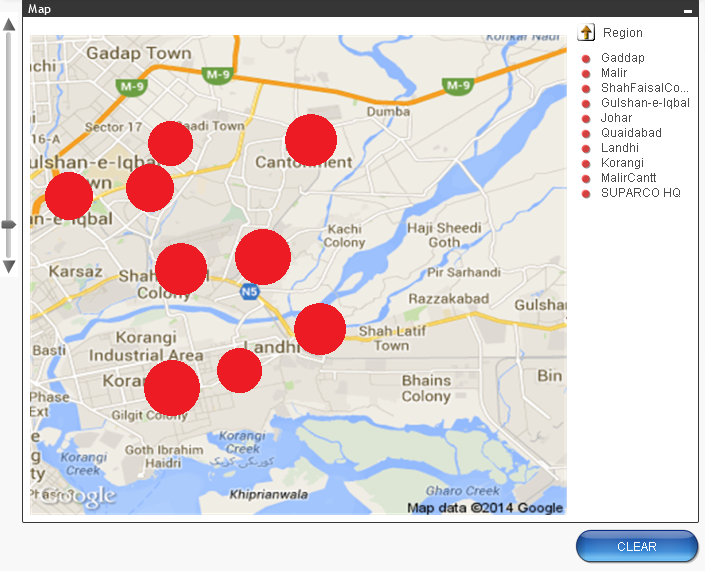
What I want is that if I make zoom in the Slider, I'd see the size of the bubbles bigger like this:

Is there any way to do that?
I'd really appreciate it...
Thanks!
- Mark as New
- Bookmark
- Subscribe
- Mute
- Subscribe to RSS Feed
- Permalink
- Report Inappropriate Content
Hi. You can set the Maximum Bubble Size in the Presentation tab of the Chart Properties but this is not dynamic and simply defines the scale of size to apply to the chart. Within this scale you have some ability to control the size by adding a further expression.

This is extremely useful as you can then give emphasis (i.e. make bigger) those bubbles which have the greatest measures. But the maximum remains set.
- Mark as New
- Bookmark
- Subscribe
- Mute
- Subscribe to RSS Feed
- Permalink
- Report Inappropriate Content
Could someone please help me on this?