Unlock a world of possibilities! Login now and discover the exclusive benefits awaiting you.
- Qlik Community
- :
- All Forums
- :
- QlikView
- :
- Scatter Plot Zoom Quartile
- Subscribe to RSS Feed
- Mark Topic as New
- Mark Topic as Read
- Float this Topic for Current User
- Bookmark
- Subscribe
- Mute
- Printer Friendly Page
- Mark as New
- Bookmark
- Subscribe
- Mute
- Subscribe to RSS Feed
- Permalink
- Report Inappropriate Content
Scatter Plot Zoom Quartile
Hello,
I have the following expressions:
Cost Per Case = SUM(SupplyChainLUOMTotalCost)/COUNT(DISTINCT SurgicalCaseSk)
Volume = COUNT(DISTINCT SurgicalCaseSk)
One dimension of SurgeonName
My scatter plot has the reference line at fractile 50, which displays as the following:
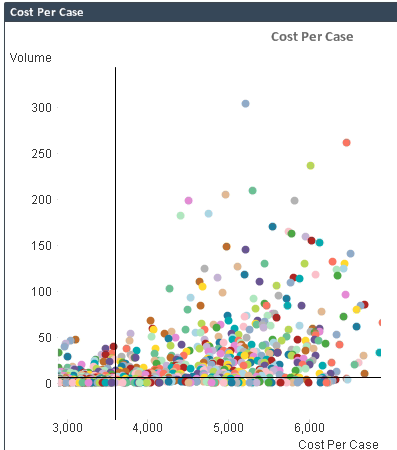
I'm trying to make it when the user clicks a single point in the scatter plot the chart zooms in to only the quartile the point falls in. However, if the user selects a range of points it will zoom in to only those points.
- Mark as New
- Bookmark
- Subscribe
- Mute
- Subscribe to RSS Feed
- Permalink
- Report Inappropriate Content
I've been playing with the static min max expressions and I have it where the x & y doesn't change using the following. I'm guessing to get into the quartiles it will be something similar with a nested if statement.
X-Axis:
Static Min
=MIN(TOTAL {1<ProcGroup=$::ProcGroup>} AGGR(SUM({1<ProcGroup=$::ProcGroup>}SupplyChainLUOMTotalCost)/SUM({1<ProcGroup=$::ProcGroup>}Cases),ProcGroup,ProcedureSurgeonName))-1000
Static Max
=MAX(TOTAL {1<ProcGroup=$::ProcGroup>} AGGR(SUM({1<ProcGroup=$::ProcGroup>}SupplyChainLUOMTotalCost)/SUM({1<ProcGroup=$::ProcGroup>}Cases),ProcGroup,ProcedureSurgeonName))-1000
Y-Axis:
Static Min
=MIN(TOTAL {1<ProcGroup=$::ProcGroup>} AGGR(SUM({1<ProcGroup=$::ProcGroup>}Cases),ProcGroup,ProcedureSurgeonName))-20
Static Max
=MAX(TOTAL {1<ProcGroup=$::ProcGroup>} AGGR(SUM({1<ProcGroup=$::ProcGroup>}Cases),ProcGroup,ProcedureSurgeonName))-20
- Mark as New
- Bookmark
- Subscribe
- Mute
- Subscribe to RSS Feed
- Permalink
- Report Inappropriate Content
please post a sample qvw to test with.
thanks
regards
Marco