Unlock a world of possibilities! Login now and discover the exclusive benefits awaiting you.
Announcements
FLASH SALE: Save $500! Use code FLASH2026 at checkout until Feb 14th at 11:59PM ET. Register Now!
- Qlik Community
- :
- All Forums
- :
- QlikView App Dev
- :
- Scatter chart
Options
- Subscribe to RSS Feed
- Mark Topic as New
- Mark Topic as Read
- Float this Topic for Current User
- Bookmark
- Subscribe
- Mute
- Printer Friendly Page
Turn on suggestions
Auto-suggest helps you quickly narrow down your search results by suggesting possible matches as you type.
Showing results for
Not applicable
2016-01-04
07:42 AM
- Mark as New
- Bookmark
- Subscribe
- Mute
- Subscribe to RSS Feed
- Permalink
- Report Inappropriate Content
Scatter chart
Hi All,
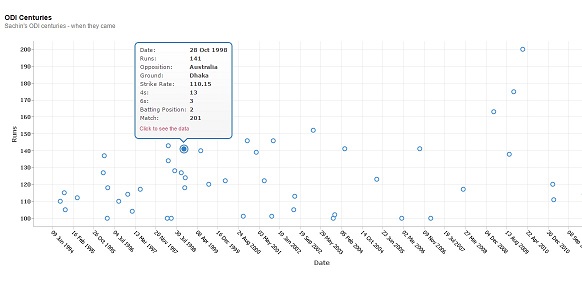
I have the following data. Based on that data how to develop scatter chart. I am using Qlikview Personal Edition,Don't send QVW file.. Please share here what is the Dimension and expressions other wise if it is possible to you share scree shots.

| Inns | Date | Opposition | Ground | Runs | Mins | Balls Faced | 4s | 6s | Strike Rate | Batting Position | Dismissal | Match |
| 1 | 16 Mar 12 | Bangladesh | Dhaka | 114 | 205 | 147 | 12 | 1 | 77.55 | 2 | caught | 462 |
| 1 | 13 Mar 12 | Sri Lanka | Dhaka | 6 | 25 | 19 | 1 | 0 | 31.57 | 2 | caught | 461 |
| 1 | 30 Mar 11 | Pakistan | Mohali | 85 | 160 | 115 | 11 | 0 | 73.91 | 2 | caught | 452 |
| 1 | 20 Mar 11 | West Indies | Chennai | 2 | 4 | 4 | 0 | 0 | 50 | 2 | caught | 450 |
| 1 | 12 Mar 11 | South Africa | Nagpur | 111 | 184 | 101 | 8 | 3 | 109.9 | 2 | caught | 449 |
| 1 | 27 Feb 11 | England | Bangalore | 120 | 170 | 115 | 10 | 5 | 104.34 | 2 | caught | 446 |
| 1 | 19 Feb 11 | Bangladesh | Dhaka | 28 | 46 | 29 | 4 | 0 | 96.55 | 2 | run out | 445 |
| 1 | 15 Jan 11 | South Africa | Johannesburg | 24 | 78 | 44 | 2 | 0 | 54.54 | 2 | bowled | 444 |
| 1 | 24 Feb 10 | South Africa | Gwalior | 200 | 226 | 147 | 25 | 3 | 136.05 | 2 | not out | 442 |
| 1 | 21 Feb 10 | South Africa | Jaipur | 4 | 5 | 1 | 0 | 80 | 2 | run out | 441 |
Regards
sharath
- Tags:
- new_to_qlikview
332 Views
1 Reply
Master
2016-01-04
07:48 AM
- Mark as New
- Bookmark
- Subscribe
- Mute
- Subscribe to RSS Feed
- Permalink
- Report Inappropriate Content
Hi ,
Create a scatter chart with ,
Dimension:
Date
Expression:
All your required data in Simple Expression (Fields),
Sum (Runs)
HTH,
Hirish
HirisH
285 Views