Unlock a world of possibilities! Login now and discover the exclusive benefits awaiting you.
- Qlik Community
- :
- All Forums
- :
- QlikView App Dev
- :
- Re: Script wise Dimension
- Subscribe to RSS Feed
- Mark Topic as New
- Mark Topic as Read
- Float this Topic for Current User
- Bookmark
- Subscribe
- Mute
- Printer Friendly Page
- Mark as New
- Bookmark
- Subscribe
- Mute
- Subscribe to RSS Feed
- Permalink
- Report Inappropriate Content
Script wise Dimension
Guys,
I have the data as shown below,
| Field | Customer | ID |
|---|---|---|
| A | C1 | 1 |
| B | C2 | 2 |
| C | C1 | 3 |
| D | C2 | 1 |
Expected Output:
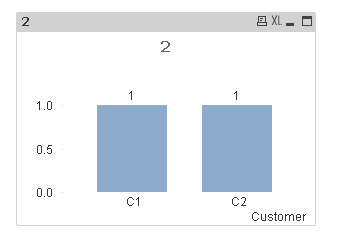
I want the no. of Fields which has same IDs. Both fields have same IDs but from different customers in the above bar chart. I've got the answer for this using expression, but I need to bring it as a dimension in script.
Please help.
- « Previous Replies
-
- 1
- 2
- Next Replies »
- Mark as New
- Bookmark
- Subscribe
- Mute
- Subscribe to RSS Feed
- Permalink
- Report Inappropriate Content
I need this expression to be converted into a dimension,
Count({<Customer=E(Customer),WithProp_ID=P(WithProp_ID)>}FieldName)
- Mark as New
- Bookmark
- Subscribe
- Mute
- Subscribe to RSS Feed
- Permalink
- Report Inappropriate Content
Dimension
=Aggr(If(Only({1}Customer) <> Only(TOTAL Customer) and SubStringCount(Concat(DISTINCT TOTAL '|' &WithProp_ID & '|'), '|'&Only({1}WithProp_ID)&'|') = 1, Only({<Customer>}Customer)), Customer, WithProp_ID)
Expression
Count({<Customer>}FieldName)
But note that this is going to give you really bad performance, I have no idea why you would want to use this, but since you asked, here you have 
- Mark as New
- Bookmark
- Subscribe
- Mute
- Subscribe to RSS Feed
- Permalink
- Report Inappropriate Content
Thank you.. it's looking great. But I asked you whether we can convert this expression into a dimension in the script and not in the chart. Is this possible that way?
- Mark as New
- Bookmark
- Subscribe
- Mute
- Subscribe to RSS Feed
- Permalink
- Report Inappropriate Content
I guess I am failing to understand the use case to answer this... may be someone else can pitch in because unless I know what is the use case, I might give a solution which may or may not work for your real scenario
- Mark as New
- Bookmark
- Subscribe
- Mute
- Subscribe to RSS Feed
- Permalink
- Report Inappropriate Content
Ok thank you so much Sunny. Shall I provide you the use case now? Use case in the sense, you're asking real time scenario for this.
- Mark as New
- Bookmark
- Subscribe
- Mute
- Subscribe to RSS Feed
- Permalink
- Report Inappropriate Content
I meant to say a detailed test case, in a sense are you going to be making other selection after the selection in Customer, because if you do, then it might make it nearly impossible to do in the script. On the other hand, if selecting customer is the only thing you are planning to do... then this might work... I don't know... because I am not sure what all the users are going to select and how the real data model looks like
- Mark as New
- Bookmark
- Subscribe
- Mute
- Subscribe to RSS Feed
- Permalink
- Report Inappropriate Content
Sunny, I've attached my QVW, 50% completed. Please have a look at my original post for it.
In reusability tab, I have my doubted scenarios.
- Mark as New
- Bookmark
- Subscribe
- Mute
- Subscribe to RSS Feed
- Permalink
- Report Inappropriate Content
Hello,
I may be too late for this thread. I must say its a bit confusing. I may be mistaken. but at least I tried 🙂
Based on the excel that you posted:
S2:
LOAD FieldName,
[Data type],
[Min Occurs],
[Max Occurs],
[M/C/O],
Length,
Customer
FROM
[..\Downloads\S2.xlsx]
(ooxml, embedded labels);
Join
Load FieldName,Count(FieldName) as ct
Resident S2
Group by FieldName;
Finaltable:
LOAD FieldName ,Customer
Resident S2
WHERE ct>1;
DROP Table S2;
Your chart Dimension will then be Cutomer, The expression would be Count(Customer)
Please have a look and I hope it helps.
- Mark as New
- Bookmark
- Subscribe
- Mute
- Subscribe to RSS Feed
- Permalink
- Report Inappropriate Content
Thanks for your help Imad..
- Mark as New
- Bookmark
- Subscribe
- Mute
- Subscribe to RSS Feed
- Permalink
- Report Inappropriate Content
Sunny, please find the attached QVW file and suggest an idea. since you don't know my data model, please have a look at it.
- « Previous Replies
-
- 1
- 2
- Next Replies »