Unlock a world of possibilities! Login now and discover the exclusive benefits awaiting you.
- Qlik Community
- :
- All Forums
- :
- QlikView App Dev
- :
- Select filters with Gauge Chart (Text)
- Subscribe to RSS Feed
- Mark Topic as New
- Mark Topic as Read
- Float this Topic for Current User
- Bookmark
- Subscribe
- Mute
- Printer Friendly Page
- Mark as New
- Bookmark
- Subscribe
- Mute
- Subscribe to RSS Feed
- Permalink
- Report Inappropriate Content
Select filters with Gauge Chart (Text)
Hi,
can I select the filters in a Gauge Chart, like in a Bar chart?
I mean, I have a gauge chart (the text one, that only show a green big number). What I want is when I pressed on it, automatically select the possible values in the filters above, as it happens when selecting in a line or bar chart.
Thanks in advance.
- « Previous Replies
-
- 1
- 2
- Next Replies »
- Mark as New
- Bookmark
- Subscribe
- Mute
- Subscribe to RSS Feed
- Permalink
- Report Inappropriate Content
on gauge chart you can trigger action;
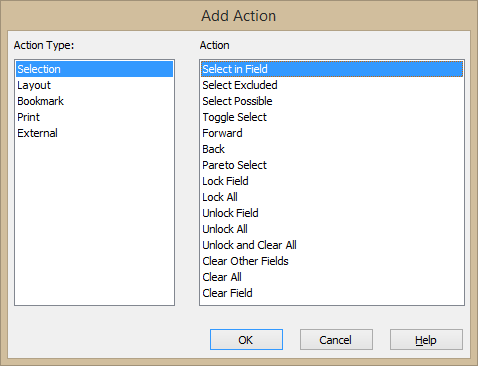
goto Chart properties --> Actions --> Add --> Selection as Action Type
- Mark as New
- Bookmark
- Subscribe
- Mute
- Subscribe to RSS Feed
- Permalink
- Report Inappropriate Content
I want something like this, when I click inside the Gauge Chart (Installed 192).

- Mark as New
- Bookmark
- Subscribe
- Mute
- Subscribe to RSS Feed
- Permalink
- Report Inappropriate Content
I don't have that option ![]()
I'm using 11.2:

- Mark as New
- Bookmark
- Subscribe
- Mute
- Subscribe to RSS Feed
- Permalink
- Report Inappropriate Content
in your screenshot with the triggers use "Select Possible" and there put your region field name
- Mark as New
- Bookmark
- Subscribe
- Mute
- Subscribe to RSS Feed
- Permalink
- Report Inappropriate Content
Now, when I click on the gauge chart, it select all the regions (in green), and not only the right ones.
The number in the gauge chart is calculated like sum(isIntalled).
The table is something like this:
ID Name Region IsInstalled
1 aaaa Madrid 1
2 bbbb Murcia 0
3 cccc Salaman 0
4 dddd Coruña 1
5 eeee Madrid 1
So when I click on the gauge chart, I want just the regions Madrid/Coruña to be selected.
- Mark as New
- Bookmark
- Subscribe
- Mute
- Subscribe to RSS Feed
- Permalink
- Report Inappropriate Content
Which regions are the rights ones?
If you need the possible region, --> Michael answer
If you need a static (always the same) selection use
select in field
Field=Region
Search String='("A*"|"*B*")' in your case ='("Madrid"|"Coruña")'
or perhaps
select in field
Field=IsInstalled
Search String=1
- Mark as New
- Bookmark
- Subscribe
- Mute
- Subscribe to RSS Feed
- Permalink
- Report Inappropriate Content
sorry. see attached
- Mark as New
- Bookmark
- Subscribe
- Mute
- Subscribe to RSS Feed
- Permalink
- Report Inappropriate Content
I want all the possible regions, but Michael's answer is not working as I want.
Could it be because all the regions are valid options for the gauge chart? I mean, even when the sum is 0.
For example, if I only had 2 regions:
- If I selected Aragón, the gauge chart shows 0.
- If I select Madrid, the gauge chart shows shows 5.
So, what I want is when I click on the gauge chart, it select only Madrid, but when I click it select both Madrid and Aragón.
The expression in the gauge chart is SUM(isInstalled)
- Mark as New
- Bookmark
- Subscribe
- Mute
- Subscribe to RSS Feed
- Permalink
- Report Inappropriate Content
in my file it works with the new field in script. or i misunderstood your issue
- « Previous Replies
-
- 1
- 2
- Next Replies »