Unlock a world of possibilities! Login now and discover the exclusive benefits awaiting you.
Announcements
April 13–15 - Dare to Unleash a New Professional You at Qlik Connect 2026: Register Now!
- Qlik Community
- :
- All Forums
- :
- QlikView App Dev
- :
- Set Analysis Question
Options
- Subscribe to RSS Feed
- Mark Topic as New
- Mark Topic as Read
- Float this Topic for Current User
- Bookmark
- Subscribe
- Mute
- Printer Friendly Page
Turn on suggestions
Auto-suggest helps you quickly narrow down your search results by suggesting possible matches as you type.
Showing results for
Anonymous
Not applicable
2015-06-25
09:30 PM
- Mark as New
- Bookmark
- Subscribe
- Mute
- Subscribe to RSS Feed
- Permalink
- Report Inappropriate Content
Set Analysis Question
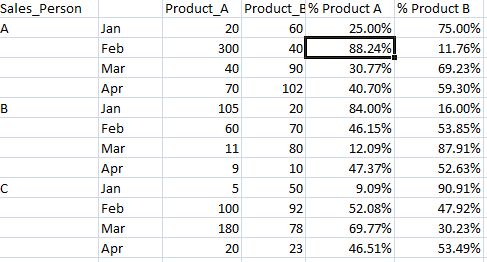
I have sales person and month as dimensions and sales of Product_A and Product_B as measure. I want ultimately create a bar chart to display % of product sales per month see below
Can some one help?

Data in the table

and ultimately a bar chart like

704 Views
5 Replies
Anonymous
Not applicable
2015-06-25
09:50 PM
Author
- Mark as New
- Bookmark
- Subscribe
- Mute
- Subscribe to RSS Feed
- Permalink
- Report Inappropriate Content
See attached
608 Views
Anonymous
Not applicable
2015-06-25
10:04 PM
Author
- Mark as New
- Bookmark
- Subscribe
- Mute
- Subscribe to RSS Feed
- Permalink
- Report Inappropriate Content
Modified my solution after you added a picture ![]()

608 Views
Anonymous
Not applicable
2015-06-25
10:17 PM
Author
- Mark as New
- Bookmark
- Subscribe
- Mute
- Subscribe to RSS Feed
- Permalink
- Report Inappropriate Content
I have been doing same but get 100%in all

608 Views
Anonymous
Not applicable
2015-06-26
07:57 AM
Author
- Mark as New
- Bookmark
- Subscribe
- Mute
- Subscribe to RSS Feed
- Permalink
- Report Inappropriate Content
That means you're doing something differently. Try to compare carefully, or upload your app and I'll take a look when I have time.
608 Views
Specialist
2015-06-26
08:36 AM
- Mark as New
- Bookmark
- Subscribe
- Mute
- Subscribe to RSS Feed
- Permalink
- Report Inappropriate Content
Hi,
Try using something like this:
sum(sales)/Sum(TOTAL <MONTH> sales)
608 Views