Unlock a world of possibilities! Login now and discover the exclusive benefits awaiting you.
Announcements
Save $650 on Qlik Connect, Dec 1 - 7, our lowest price of the year. Register with code CYBERWEEK: Register
- Qlik Community
- :
- All Forums
- :
- QlikView App Dev
- :
- Show all Values in the Line Chart but only Specifi...
Options
- Subscribe to RSS Feed
- Mark Topic as New
- Mark Topic as Read
- Float this Topic for Current User
- Bookmark
- Subscribe
- Mute
- Printer Friendly Page
Turn on suggestions
Auto-suggest helps you quickly narrow down your search results by suggesting possible matches as you type.
Showing results for
Not applicable
2014-09-25
11:10 AM
- Mark as New
- Bookmark
- Subscribe
- Mute
- Subscribe to RSS Feed
- Permalink
- Report Inappropriate Content
Show all Values in the Line Chart but only Specific Values in the Text Dimension
Hello!
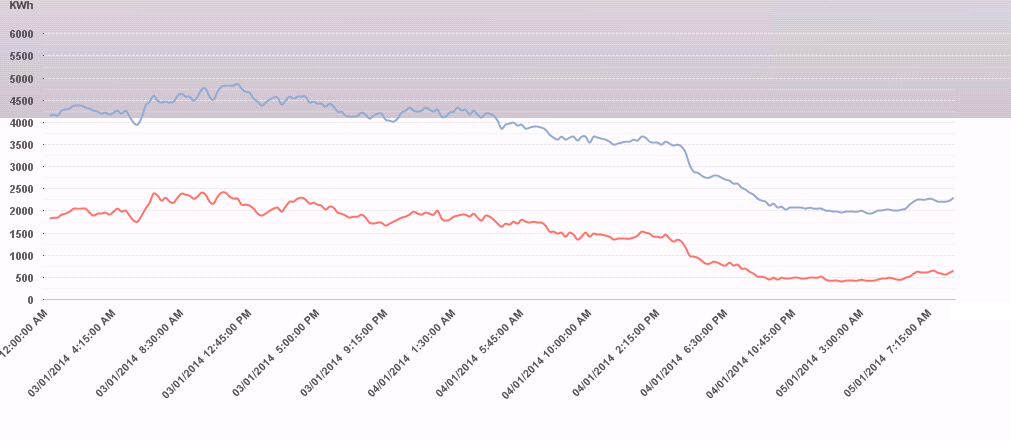
I have the following line chart:

Where the dimension (X axis) is a date with the following format (DD/MM/YYYY hh:mm:ss).
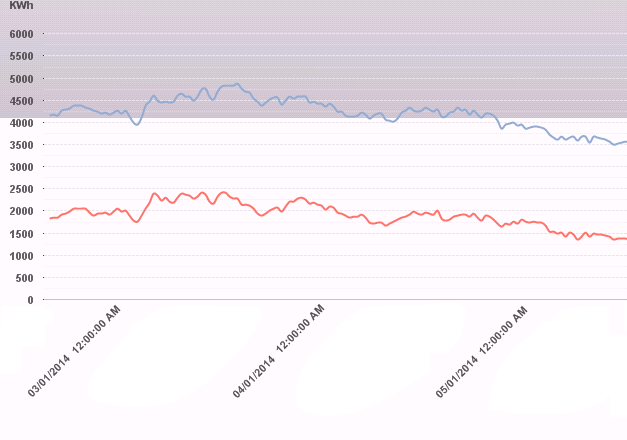
What I want is to show the dimension like this:

I mean, showing ALL the values BUT in the dimension only show the text dimension for every day at 12:00:00.
03/01/2014 12:00:00 AM
04/01/2014 12:00:00 AM
05/01/2014 12:00:00 AM
06/01/2014 12:00:00 AM
07/01/2014 12:00:00 AM
And so on...
Could that be possible?
Thank you!!!
- Tags:
- new_to_qlikview
327 Views
0 Replies