Unlock a world of possibilities! Login now and discover the exclusive benefits awaiting you.
- Qlik Community
- :
- All Forums
- :
- QlikView App Dev
- :
- Re: Show only date of Max(ActualHrs)
- Subscribe to RSS Feed
- Mark Topic as New
- Mark Topic as Read
- Float this Topic for Current User
- Bookmark
- Subscribe
- Mute
- Printer Friendly Page
- Mark as New
- Bookmark
- Subscribe
- Mute
- Subscribe to RSS Feed
- Permalink
- Report Inappropriate Content
Show only date of Max(ActualHrs)
Working to show only single scheduled date for the date that each person had the maximum hours during a selected time frame in pivot table with 3 dimensions.
Current table view
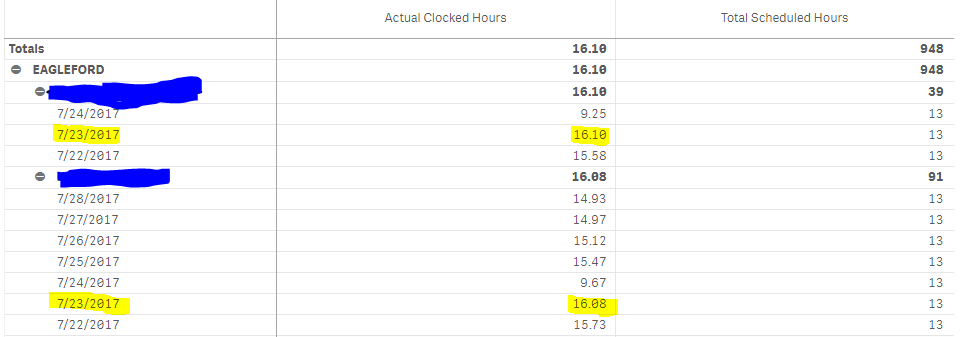
Would like it to only display 7/23 (Highlighted) date for both since that was max actual.
Accepted Solutions
- Mark as New
- Bookmark
- Subscribe
- Mute
- Subscribe to RSS Feed
- Permalink
- Report Inappropriate Content
Change your dimension that contains the date field to this:
=aggr(FirstSortedValue(DateField, -[Actual Clocked Hours]), Dimension1, Dimension2)
- Mark as New
- Bookmark
- Subscribe
- Mute
- Subscribe to RSS Feed
- Permalink
- Report Inappropriate Content
If I'm understanding correctly, the following should do the trick:
=max(TOTAL <Dimension1, Dimension2, Dimension3> [Actual Clocked Hours])
- Mark as New
- Bookmark
- Subscribe
- Mute
- Subscribe to RSS Feed
- Permalink
- Report Inappropriate Content
No, sorry I was probably not clear enough.
Would like to only see 1 line under each persons name with the date for the highest hours within that week.
- Mark as New
- Bookmark
- Subscribe
- Mute
- Subscribe to RSS Feed
- Permalink
- Report Inappropriate Content
Change your dimension that contains the date field to this:
=aggr(FirstSortedValue(DateField, -[Actual Clocked Hours]), Dimension1, Dimension2)
- Mark as New
- Bookmark
- Subscribe
- Mute
- Subscribe to RSS Feed
- Permalink
- Report Inappropriate Content
My scheduled hours are still showing the weekly total. Any thoughts or would probably need to load sample?
- Mark as New
- Bookmark
- Subscribe
- Mute
- Subscribe to RSS Feed
- Permalink
- Report Inappropriate Content
I would suggest making a flag using a left join like this:
Data:
LOAD * INLINE [
Dimension1, Dimension2, DateField, Actual Clocked Hours
EAGLEFORD, Name 1, 7/22/2017, 15.58
EAGLEFORD, Name 1, 7/23/2017, 16.10
EAGLEFORD, Name 1, 7/24/2017, 9.25
EAGLEFORD, Name 2, 7/22/2017, 15.73
EAGLEFORD, Name 2, 7/23/2017, 16.08
EAGLEFORD, Name 2, 7/24/2017, 9.67
EAGLEFORD, Name 2, 7/25/2017, 15.47
EAGLEFORD, Name 2, 7/26/2017, 15.12
EAGLEFORD, Name 2, 7/27/2017, 14.97
EAGLEFORD, Name 2, 7/28/2017, 14.93
];


LEFT JOIN (Data)
LOAD Dimension1,
Dimension2,
FirstSortedValue(DateField, -[Actual Clocked Hours]) AS DateField,
1 AS Max_Flag
RESIDENT Data
GROUP BY Dimension1, Dimension2;
Then on your chart, you can have three dimensions:
- Dimension1
- Dimension2
- =aggr(FirstSortedValue(DateField, -[Actual Clocked Hours]), Dimension1, Dimension2)
And your expression can be:
- sum({<Max_Flag={1}>}[Actual Clocked Hours])
I have also attached an example file with the above code.