Unlock a world of possibilities! Login now and discover the exclusive benefits awaiting you.
- Qlik Community
- :
- All Forums
- :
- QlikView App Dev
- :
- Showing Percentage Totals by Year
- Subscribe to RSS Feed
- Mark Topic as New
- Mark Topic as Read
- Float this Topic for Current User
- Bookmark
- Subscribe
- Mute
- Printer Friendly Page
- Mark as New
- Bookmark
- Subscribe
- Mute
- Subscribe to RSS Feed
- Permalink
- Report Inappropriate Content
Showing Percentage Totals by Year
Hello,
Thank you for taking this question in advance.
Basically, I have data that spans across 4 years (2011, 2012, 2013, 2014). I want to show it by two Dimensions, 'Engaged' which is either a Yes or No, and over each year.
I want the percentages to show 'Y' or 'N' for 100% across EACH year, rather than 100% across all 4 years (which is how it currently shows).
Example: For 2011, I want 'Y' to show for 70% and 'N' to show for 30%, 2012 to show 'Y' for 80% and 'N' to show for 20%, rather than showing all the 'Y' and 'N' 2011 + 2012 + 2013+ 2014 adding up to 100%.
I have attached screen shots below of what the graph currently shows, along with the dimensions and expression.
I really appreciate the help!
Thanks!
- « Previous Replies
- Next Replies »
Accepted Solutions
- Mark as New
- Bookmark
- Subscribe
- Mute
- Subscribe to RSS Feed
- Permalink
- Report Inappropriate Content
See if this one works:
For Yes:
=Count({<Engaged={'y'},[IPO Type]={'IPOs Filed & Priced'},[Expected / Actual Amount raised] = {'>=150000000'}>}DISTINCT id)/Count(distinct id)
For No:
=Count({<Engaged={'n'},[IPO Type]={'IPOs Filed & Priced'},[Expected / Actual Amount raised] = {'>=150000000'}>}DISTINCT id)/Count(distinct id)
Best,
S
- Mark as New
- Bookmark
- Subscribe
- Mute
- Subscribe to RSS Feed
- Permalink
- Report Inappropriate Content
please provide sample data
thanks
regards
Marco
- Mark as New
- Bookmark
- Subscribe
- Mute
- Subscribe to RSS Feed
- Permalink
- Report Inappropriate Content
Hello,
Please find the sample data attached in the original post.
The attachments I added were 'Sample Data' and 'Year'.
I also have included the calculated field of Year Filed, which is just the year of the 'Last Filing Date' field within the Sample Data.
Thanks in advance!
- Mark as New
- Bookmark
- Subscribe
- Mute
- Subscribe to RSS Feed
- Permalink
- Report Inappropriate Content
hi Ryan,
i created a small data set for myself to get what your requirement is, you can achieve this by creating 2 expressions each enagaged as 'n' and engaged as 'y'. and dimenssion as year.
trigger:
LOAD * INLINE [
id, Engaged, year, client name
1, n, 2014, abc
2, y, 2014, def
3, n, 2013, cfe
4, y, 2013, der
5, n, 2012, des
6, y, 2011, sas
7, y, 2014, qv
8, n, 2013, pyth
9, n, 2011, cpl
10, n, 2011, cog
];
the 2 expressions i used are:
=(
Count({<Engaged={'y'}>}DISTINCT id))/Count(distinct id)
=(
Count({<Engaged={'n'}>}DISTINCT id))/Count(distinct id)
- Mark as New
- Bookmark
- Subscribe
- Mute
- Subscribe to RSS Feed
- Permalink
- Report Inappropriate Content
How about changing the expression to
count(DISTINCT id) / count(TOTAL<[Year Filed]> id)
-Rob
- Mark as New
- Bookmark
- Subscribe
- Mute
- Subscribe to RSS Feed
- Permalink
- Report Inappropriate Content
Hello Rob,
I'm trying to get the Denominator count by Year by using the AGGR function :
=Aggr(count(distinct ID),Last_Filing_year).
It shows the aggregated count correctly in one row of the year,while for the other row it shows as null.
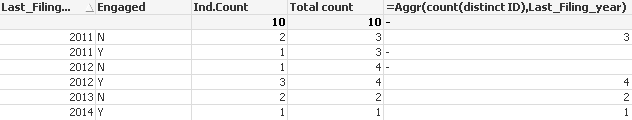
Could you Please let me know what am I doing wrong here.
Thanks,
Kalyan
- Mark as New
- Bookmark
- Subscribe
- Mute
- Subscribe to RSS Feed
- Permalink
- Report Inappropriate Content
You'll need to add the NODISTINCT qualifier to aggr().
By the way, I'd suggest that aggr() is the wrong function to use here. I would recommend TOTAL unless there is some other reason you need aggr(). (of course that's not what you asked  )
)
count(TOTAL <Last_Filing_year> distinct ID)
-Rov
- Mark as New
- Bookmark
- Subscribe
- Mute
- Subscribe to RSS Feed
- Permalink
- Report Inappropriate Content
Ok...Thank You very much Rob..:)
- Mark as New
- Bookmark
- Subscribe
- Mute
- Subscribe to RSS Feed
- Permalink
- Report Inappropriate Content
Hi!
Thank you, using the above expression worked! I would now like to take this a step further, and add a couple of other conditionals.
The current expressions I have now are the two below:
Count({<Engaged={'y'}>}DISTINCT id))/Count(distinct id)
Count({<Engaged={'n'}>}DISTINCT id))/Count(distinct id)
I would like to add:
if( [IPO Type]='IPOs Filed & Priced',if([Expected / Actual Amount raised]>= 150000000
But am not sure how to incorporate this into my current expression. Is it an 'AND' statement? I am new to writing expressions in Qlik.
Thanks very much!
- Mark as New
- Bookmark
- Subscribe
- Mute
- Subscribe to RSS Feed
- Permalink
- Report Inappropriate Content
Hi Saurabh,
I apologize for the double post, but I still cannot figure this out. If you, or anyone else, could respond to my post below it would be MUCH appreciated!!!
Thank you, using the above expression worked! I would now like to take this a step further, and add a couple of other conditionals.
The current expressions I have now are the two below:
Count({<Engaged={'y'}>}DISTINCT id))/Count(distinct id)
Count({<Engaged={'n'}>}DISTINCT id))/Count(distinct id)
I would like to add:
if( [IPO Type]='IPOs Filed & Priced',if([Expected / Actual Amount raised]>= 150000000
But am not sure how to incorporate this into my current expression. Is it an 'AND' statement? I am new to writing expressions in Qlik.
Thanks very much!
- « Previous Replies
- Next Replies »