Unlock a world of possibilities! Login now and discover the exclusive benefits awaiting you.
- Qlik Community
- :
- All Forums
- :
- QlikView App Dev
- :
- Re: Showing rows only with multiple events
- Subscribe to RSS Feed
- Mark Topic as New
- Mark Topic as Read
- Float this Topic for Current User
- Bookmark
- Subscribe
- Mute
- Printer Friendly Page
- Mark as New
- Bookmark
- Subscribe
- Mute
- Subscribe to RSS Feed
- Permalink
- Report Inappropriate Content
Showing rows only with multiple events
Hi,
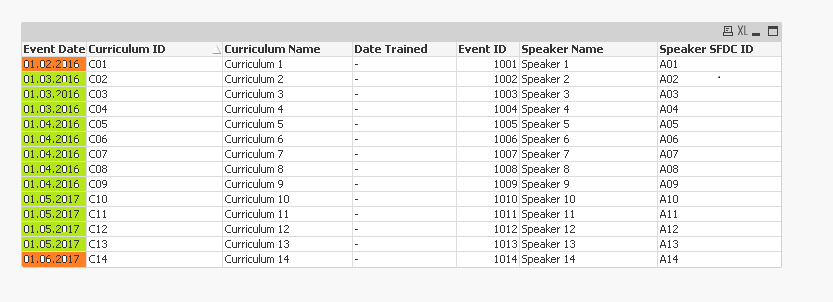
In a pivot able, i want to show event dates which has multiple events as below. In the below image, event date 01/03/2016,01/04/2016 and 01/05/2017 has multiple curriculum names and speaker names, hence i want to display only these dates.
Dates like 01/02/2016 and 01/06/2017 are having single curriculum name and speaker name, hence i want to eliminate these rows.
Kindly help.
In the below image, i want only rows highlighted in green color and remove which are highlighted in red. Please find the excel and QVW attached.
- « Previous Replies
- Next Replies »
Accepted Solutions
- Mark as New
- Bookmark
- Subscribe
- Mute
- Subscribe to RSS Feed
- Permalink
- Report Inappropriate Content
Try this as a calculated dimension
=Aggr(If(Count(TOTAL <[Event Start Date]> DISTINCT {<[Event Status]-={'DROPPED','HOLD','CANCEL'},[Event Type]={'SPKRPGM'},[Site Participant Attendance Status]={'ACCEPTED','ATTENDED'}>}If(Len(Trim([Date Trained])) = 0, [Vendor Event ID])) > 1, [Vendor Event ID]), [Event Start Date], [Vendor Event ID])

- Mark as New
- Bookmark
- Subscribe
- Mute
- Subscribe to RSS Feed
- Permalink
- Report Inappropriate Content
May be use a straight table to do this
Dimensions
All your fields
Expression
=If(Count(TOTAL <[Event Date]> [Event Date]) > 2, 1)
Hide the expression on the presentation tab
- Mark as New
- Bookmark
- Subscribe
- Mute
- Subscribe to RSS Feed
- Permalink
- Report Inappropriate Content
Thank you for quick reply. Could you please help me to get the result at dimension level. please find the updated excel file attached. and also using this below expression in my pivot table.please consider this expression and please provide the solution at dimension level.
=if(len(trim([Date Trained])) = 0, COUNT({<[Event Status]-={'DROPPED','HOLD','CANCEL'},[Event Type]={'SPKRPGM'},[Site Participant Attendance Status]={'ACCEPTED','ATTENDED'}>}[Vendor Event ID]))
- Mark as New
- Bookmark
- Subscribe
- Mute
- Subscribe to RSS Feed
- Permalink
- Report Inappropriate Content
Your sample data doesn't even have some of the fields from your expression.... leaving that part aside, may be you can try this as your calculated dimension
=Aggr(If(Count([Event Date]) > 2, [Event Date]), [Event Date])
Make sure to check 'Suppress When Value Is Null' on the dimension tab of the chart properties
- Mark as New
- Bookmark
- Subscribe
- Mute
- Subscribe to RSS Feed
- Permalink
- Report Inappropriate Content
Thanks Sunny.
Actually your expression is working fine without the below expression. However when i use the below expression i am not getting the desired result.
=if(len(trim([Date Trained])) = 0, COUNT({<[Event Status]-={'DROPPED','HOLD','CANCEL'},[Event Type]={'SPKRPGM'},[Site Participant Attendance Status]={'ACCEPTED','ATTENDED'}>} [Event ID]))
Please let me know if any of the above parameters are affecting it
- Mark as New
- Bookmark
- Subscribe
- Mute
- Subscribe to RSS Feed
- Permalink
- Report Inappropriate Content
May be you need to add the set analysis when you count in your aggr dimension
=Aggr(If(Count({<[Event Status] -= {'DROPPED','HOLD','CANCEL'}, [Event Type] = {'SPKRPGM'}, [Site Participant Attendance Status] = {'ACCEPTED','ATTENDED'}>} [Event Date]) > 2, [Event Date]), [Event Date])
- Mark as New
- Bookmark
- Subscribe
- Mute
- Subscribe to RSS Feed
- Permalink
- Report Inappropriate Content
Hi All,
It may be help u ..
- Mark as New
- Bookmark
- Subscribe
- Mute
- Subscribe to RSS Feed
- Permalink
- Report Inappropriate Content
Sorry Wrong Attachment
- Mark as New
- Bookmark
- Subscribe
- Mute
- Subscribe to RSS Feed
- Permalink
- Report Inappropriate Content
Sorry Again..
- Mark as New
- Bookmark
- Subscribe
- Mute
- Subscribe to RSS Feed
- Permalink
- Report Inappropriate Content
Its My Bad
- « Previous Replies
- Next Replies »