Unlock a world of possibilities! Login now and discover the exclusive benefits awaiting you.
- Qlik Community
- :
- All Forums
- :
- QlikView App Dev
- :
- Snap shot of months and Incremental load
- Subscribe to RSS Feed
- Mark Topic as New
- Mark Topic as Read
- Float this Topic for Current User
- Bookmark
- Subscribe
- Mute
- Printer Friendly Page
- Mark as New
- Bookmark
- Subscribe
- Mute
- Subscribe to RSS Feed
- Permalink
- Report Inappropriate Content
Snap shot of months and Incremental load
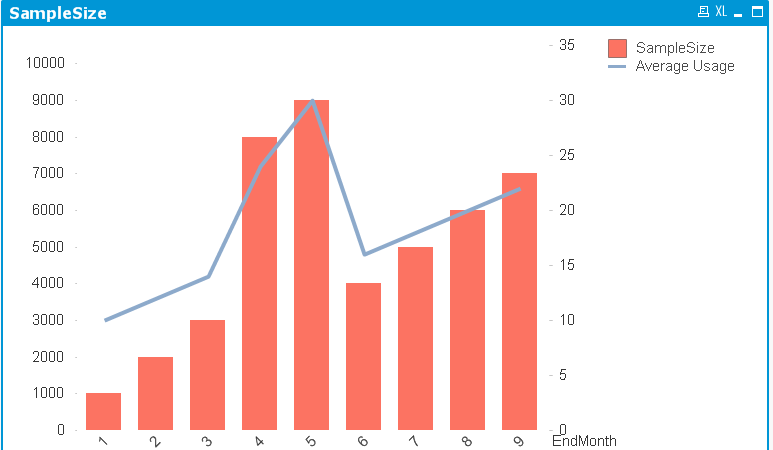
I have a chart that I am trying to create, it will look at consistency over months, the extent a product usage measurement changes on repeated readings. The data for this chart is in Vertica, this data is collected and reported daily and monthly. The problem is that we would need to capture snap shot of what the usage are monthly. The problem is that the data does change/gets updated. For example, we are in October., usage for a particulate product at EndMonth of August 31st, is 10 for the August. In October more data was reported for that product for the month of August, it changes august usage to 14. The table does not have any field that shows modified or updated date, the only date field in the table is the EndMonth(201308 etc.). How do I create a chart like below keeping in mind the data changes. The dimension is the relative month (from EndMonth).
In this situation is incremental load useful? Does it make sense doing incremental load using the update and insert formula? If so how?