Unlock a world of possibilities! Login now and discover the exclusive benefits awaiting you.
- Qlik Community
- :
- All Forums
- :
- QlikView App Dev
- :
- Re: Sort Order in a QoQ bar chart
- Subscribe to RSS Feed
- Mark Topic as New
- Mark Topic as Read
- Float this Topic for Current User
- Bookmark
- Subscribe
- Mute
- Printer Friendly Page
- Mark as New
- Bookmark
- Subscribe
- Mute
- Subscribe to RSS Feed
- Permalink
- Report Inappropriate Content
Sort Order in a QoQ bar chart
Dear all,
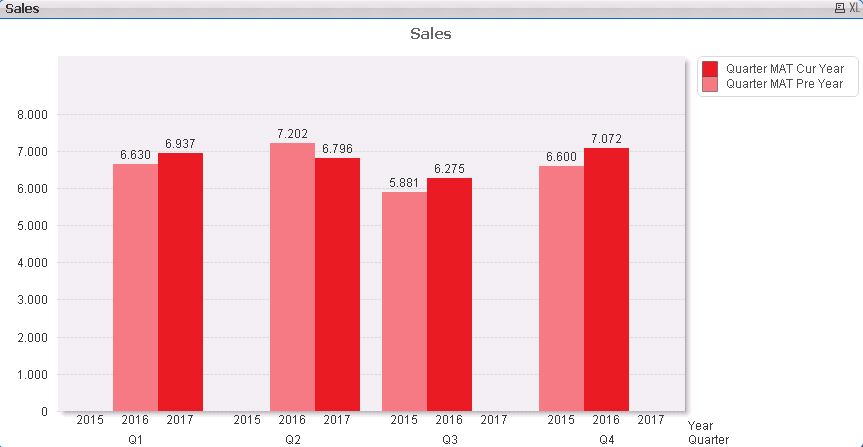
I try to create a bar chart with a Quarter over Quarter and Year over Year comparison.
The below Screenshot is displaying the current status of my development.
Currently I stuck at two points:
a) The sort order of the Bars, the sorting should start on the right side with the last full Quarter Q2 - 2017 compared with Q2 - 2016 to the left ending with Q3 - 2016 compared with Q3 - 2015.
b) Hiding the empty Year Bars in the chart
Until now I tried to solve this with the default Sorting settings.
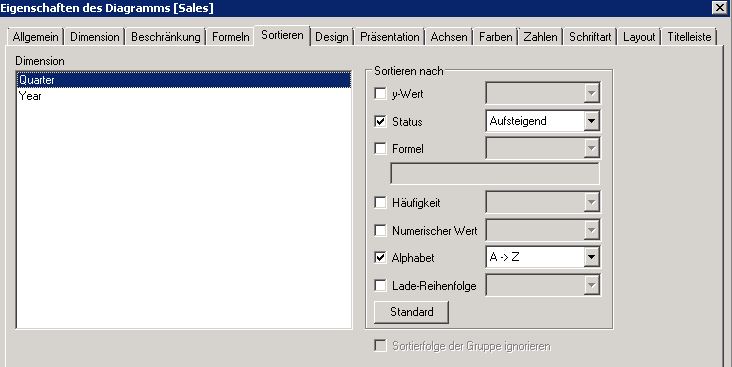
Is there a way to solve my questions within QlikView or do I have to setup a "special" Dimension in the Script?
Many thanks in advance and best regards,
Claus
Accepted Solutions
- Mark as New
- Bookmark
- Subscribe
- Mute
- Subscribe to RSS Feed
- Permalink
- Report Inappropriate Content
- Mark as New
- Bookmark
- Subscribe
- Mute
- Subscribe to RSS Feed
- Permalink
- Report Inappropriate Content
I assume, You need Dual() function in the script itself as you are not aware we can not make as 2 dimensions with as need
- Mark as New
- Bookmark
- Subscribe
- Mute
- Subscribe to RSS Feed
- Permalink
- Report Inappropriate Content
Many thanks for your hint. Indeed, the DUAL function could help to solve the sort question.
I'll check this out...
- Mark as New
- Bookmark
- Subscribe
- Mute
- Subscribe to RSS Feed
- Permalink
- Report Inappropriate Content
Dear all,
Unfortunately until now I wasn't able to solve this question.
I tried a lot of things but nothing worked sufficient for me.
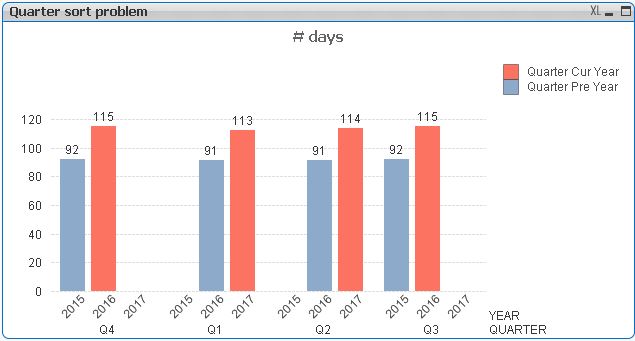
I attached a sample qvw where I tried to sort the Quarters by a YEAR-QUARTER DUAL field.
But the result is always the same... the sort order is not as expected.
Q3 has the oldest data but the Quarter is always displayed as last Quarter.
The expected sort order should be from left to right "Q3", "Q4", "Q1" and "Q2".
And it makes no difference if I hide the YEAR Dimension or not.
Maybe someone has an idea to solve this?
Many thanks in advance and best regards,
Claus
- Mark as New
- Bookmark
- Subscribe
- Mute
- Subscribe to RSS Feed
- Permalink
- Report Inappropriate Content
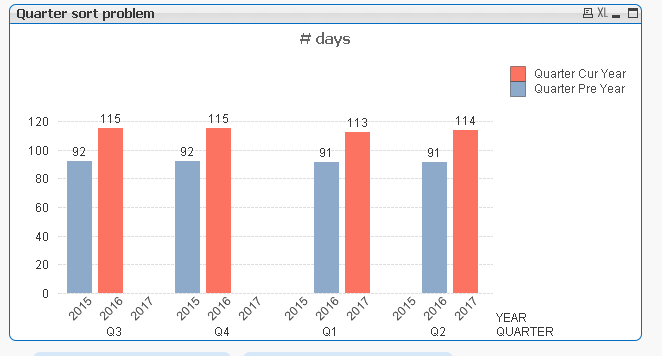
Try this
=Max({<DATE={"<=$(=QuarterEnd(Max(DATE), -2))"}>}DATE)
- Mark as New
- Bookmark
- Subscribe
- Mute
- Subscribe to RSS Feed
- Permalink
- Report Inappropriate Content
Dear Sunny,
Many thanks for your reply. Your solution solves my question totally!
Sorting by date with a limitation of the displayed Quarters looks so easy now... 🙂
Best regards,
Claus