Unlock a world of possibilities! Login now and discover the exclusive benefits awaiting you.
- Qlik Community
- :
- All Forums
- :
- QlikView App Dev
- :
- Re: Sort Stacked Chart by Y and 2nd Dimension
- Subscribe to RSS Feed
- Mark Topic as New
- Mark Topic as Read
- Float this Topic for Current User
- Bookmark
- Subscribe
- Mute
- Printer Friendly Page
- Mark as New
- Bookmark
- Subscribe
- Mute
- Subscribe to RSS Feed
- Permalink
- Report Inappropriate Content
Sort Stacked Chart by Y and 2nd Dimension
I've been asked to create a stacked chart to sort by Grand Total and then in each bar to sort the values from High to Low. When it displays all of the choices it doesn't sort High to Low for each bar but if I click on just one Location then it sorts properly, just not when all data is displayed. I saw some examples show aggr but when I tried that with my data still no luck... I've attached a sample file.
Notice Location 7 along with others are not sorted High to Low
But if I click just on Location 7 then it does sort the data properly...
Accepted Solutions
- Mark as New
- Bookmark
- Subscribe
- Mute
- Subscribe to RSS Feed
- Permalink
- Report Inappropriate Content
- Mark as New
- Bookmark
- Subscribe
- Mute
- Subscribe to RSS Feed
- Permalink
- Report Inappropriate Content
Hi Pat,
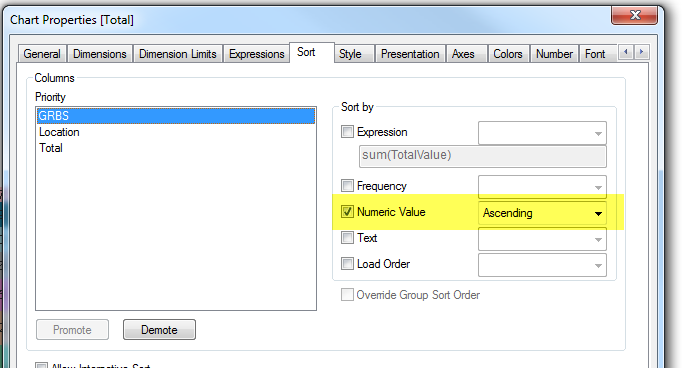
Please change your sort columns to the following:

Additionally, I noticed that your expression doesn't have any kind of aggregation around it sum(), avg() etc. Please use either the sum or only function to get your KPI's...If you have more than one value per Location GRBS combination Qlikview won't know what to do with it.
See attached for more details.
Thanks,
Camile
- Mark as New
- Bookmark
- Subscribe
- Mute
- Subscribe to RSS Feed
- Permalink
- Report Inappropriate Content
like this? see attachment

- Mark as New
- Bookmark
- Subscribe
- Mute
- Subscribe to RSS Feed
- Permalink
- Report Inappropriate Content
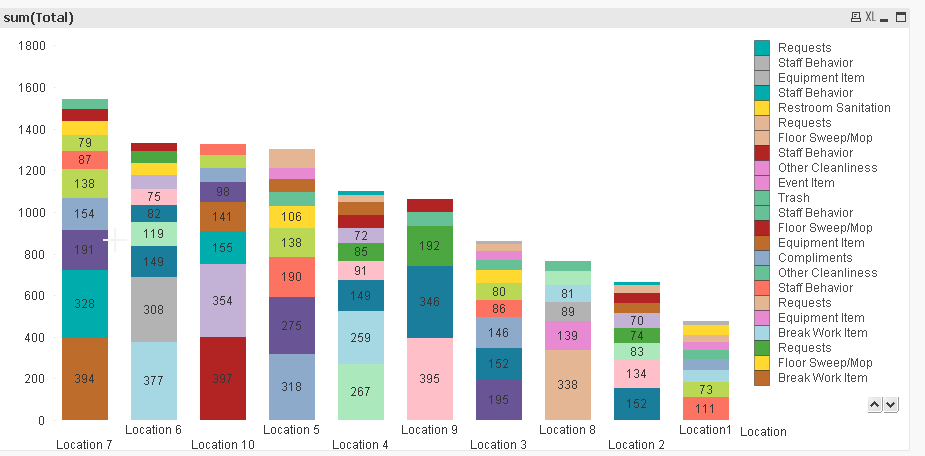
I've tried that but still doesn't sort properly as a whole. Below is an image of your option. They want me to sort each Location from High to Low by sum of Total field.
- Mark as New
- Bookmark
- Subscribe
- Mute
- Subscribe to RSS Feed
- Permalink
- Report Inappropriate Content
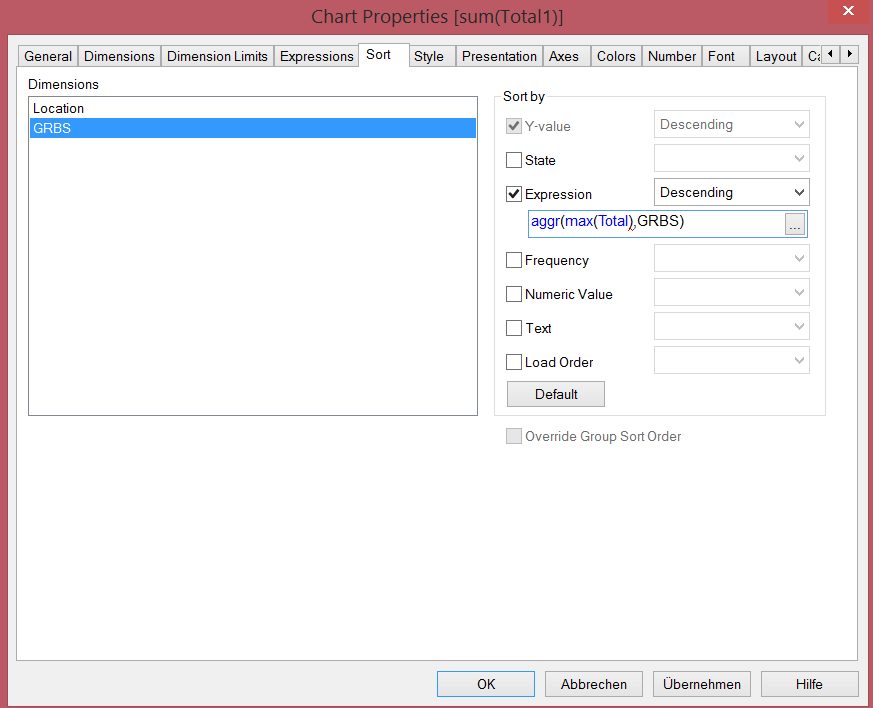
use the following sort Option
but the last two Locations are not quite correct
by the way: as you see there is a red line after max(Total)
I renamed Total to Total1 in your script and the red line was gone
Total is a reserved word, so try to avoid These reserved words


- Mark as New
- Bookmark
- Subscribe
- Mute
- Subscribe to RSS Feed
- Permalink
- Report Inappropriate Content
This is pretty close but the legend on each bar uses different colors and list the items in the legend many times with the different colors. Looks like I need to use this along with some color formatting.
- Mark as New
- Bookmark
- Subscribe
- Mute
- Subscribe to RSS Feed
- Permalink
- Report Inappropriate Content
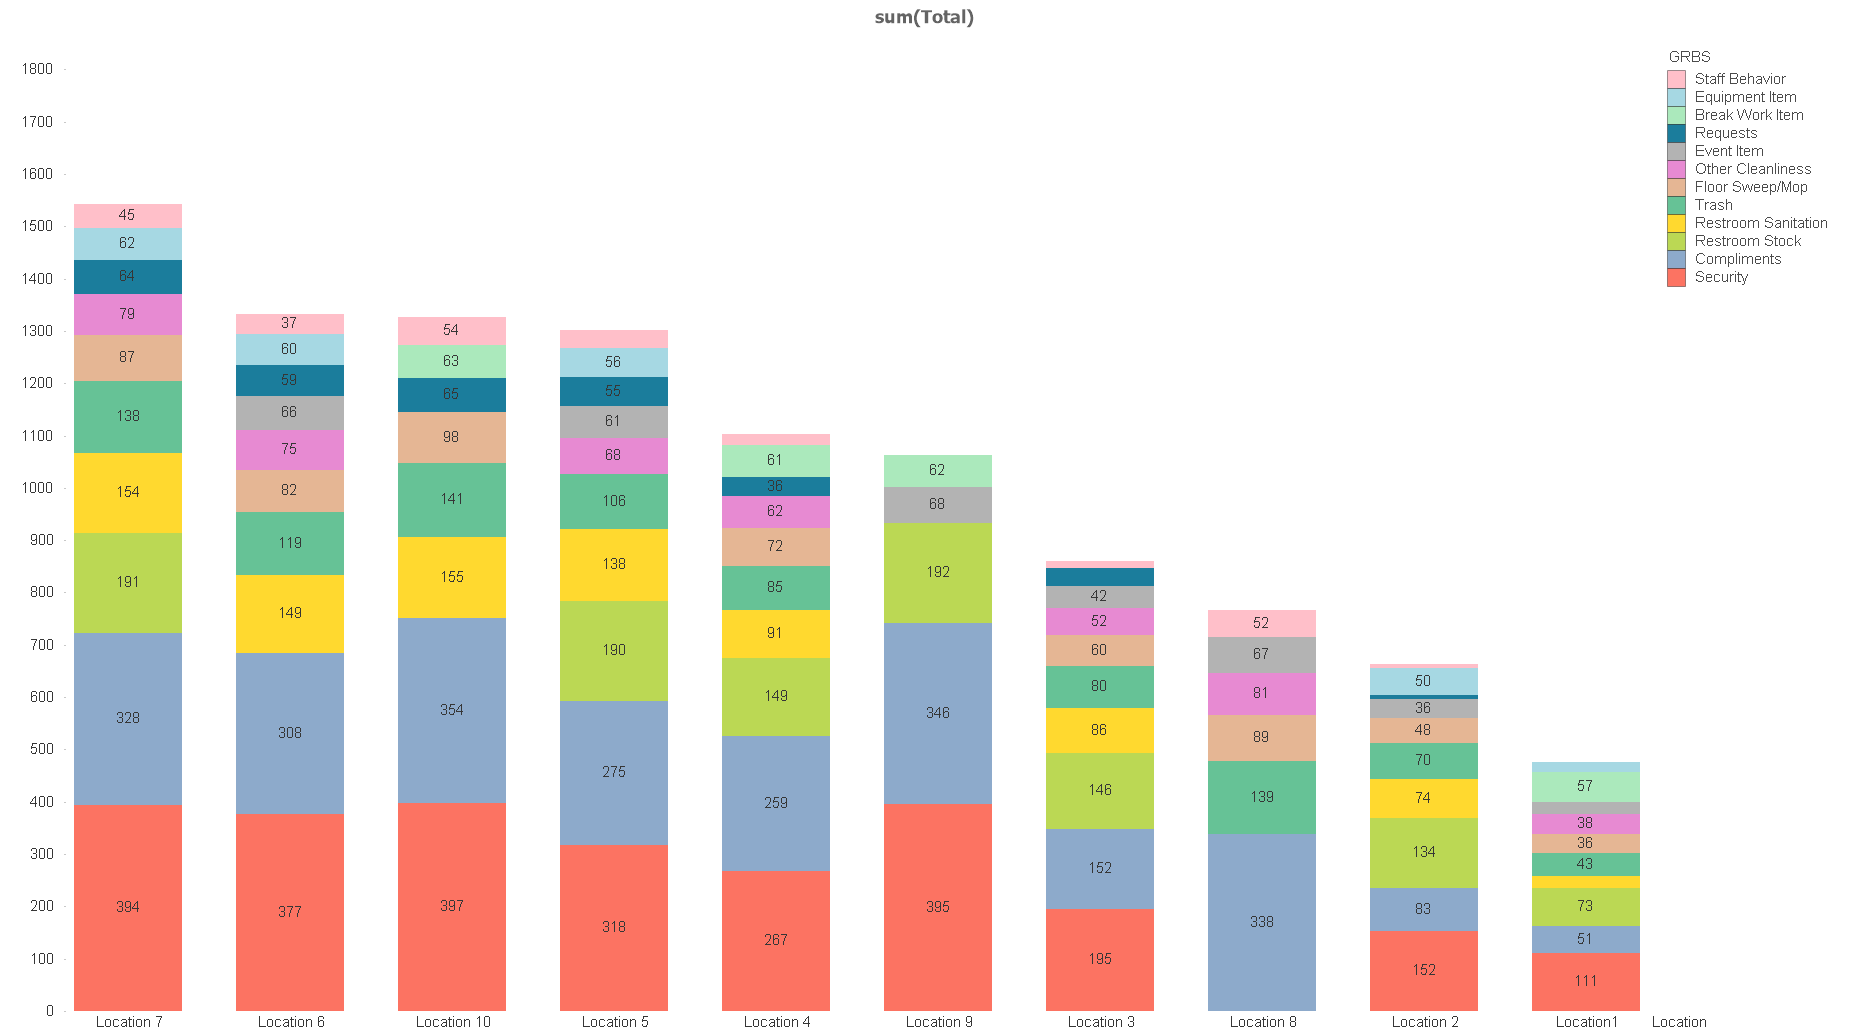
Hi,
maybe one solution could be:
hope this helps
regards
Marco
- Mark as New
- Bookmark
- Subscribe
- Mute
- Subscribe to RSS Feed
- Permalink
- Report Inappropriate Content
Thanks a lot this appears to do the trick.
- Mark as New
- Bookmark
- Subscribe
- Mute
- Subscribe to RSS Feed
- Permalink
- Report Inappropriate Content
The palette of colors is limited, in this case if we have more than 50 GRBS ! the colors is repeated so there is a way to stretch so as to have a plenty of colors?
Your help is very appreciated!