Unlock a world of possibilities! Login now and discover the exclusive benefits awaiting you.
- Qlik Community
- :
- All Forums
- :
- QlikView App Dev
- :
- Re: Sorting a the Month Dimension in a Chart
- Subscribe to RSS Feed
- Mark Topic as New
- Mark Topic as Read
- Float this Topic for Current User
- Bookmark
- Subscribe
- Mute
- Printer Friendly Page
- Mark as New
- Bookmark
- Subscribe
- Mute
- Subscribe to RSS Feed
- Permalink
- Report Inappropriate Content
Sorting a the Month Dimension in a Chart
Hello,
I have a chart which is meant to show Dimension - Month Names and the measures. shown below
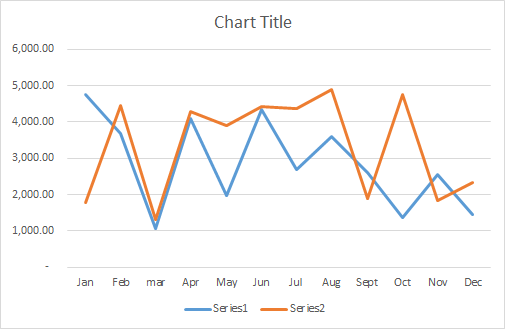
I am using a Field Called KeyDate (a number) and using a calculated Dimension =Text(Date(KeyDate,'MMM')) which returns the Month.
I don't want to use the function Month Name as I don't want the Year appended after the month E:g I want Jan instead of Jan 2014. The reason being Series 1 is for Year 2014 and Series 2 is for Year 2013.
Now the problem is that when I use the above function QV is sorting them as
Dec, Jan, Feb .... Nov
I have tried using Sort by Numeric and that doesn't seem to do the trick. I also tried using Sort by expression where my expression is
Month(KeyDate) which I expect would return an integer for the month. No luck.
Any thoughts and advise would be appreciated.
Thanks,
- Tags:
- new_to_qlikview
Accepted Solutions
- Mark as New
- Bookmark
- Subscribe
- Mute
- Subscribe to RSS Feed
- Permalink
- Report Inappropriate Content
It's because you are using text around the date, which is stripping the number off of it. Why not just use:
Month(KeyDate)
as your calculated dimension? It will return months like Jan, Feb, Mar, etc. Which is the same format you want, but yet retains the dual format of a date.
Hope this helps!
- Mark as New
- Bookmark
- Subscribe
- Mute
- Subscribe to RSS Feed
- Permalink
- Report Inappropriate Content
Just use the Month() function:
=Month(KeyDate)
and sort numeric
- Mark as New
- Bookmark
- Subscribe
- Mute
- Subscribe to RSS Feed
- Permalink
- Report Inappropriate Content
- Mark as New
- Bookmark
- Subscribe
- Mute
- Subscribe to RSS Feed
- Permalink
- Report Inappropriate Content
Thanks guys 
Amazed by the support I get in this community !