Unlock a world of possibilities! Login now and discover the exclusive benefits awaiting you.
- Qlik Community
- :
- All Forums
- :
- QlikView
- :
- Sorting timestamps
- Subscribe to RSS Feed
- Mark Topic as New
- Mark Topic as Read
- Float this Topic for Current User
- Bookmark
- Subscribe
- Mute
- Printer Friendly Page
- Mark as New
- Bookmark
- Subscribe
- Mute
- Subscribe to RSS Feed
- Permalink
- Report Inappropriate Content
Sorting timestamps
Hello.
I have scrip that link Year and Month:
num(Year (timestamp(max(EventEndDate)))) & num(Month (timestamp(max(EventEndDate)))) as EventEndYearMonth
however in chart I get wierd compination:
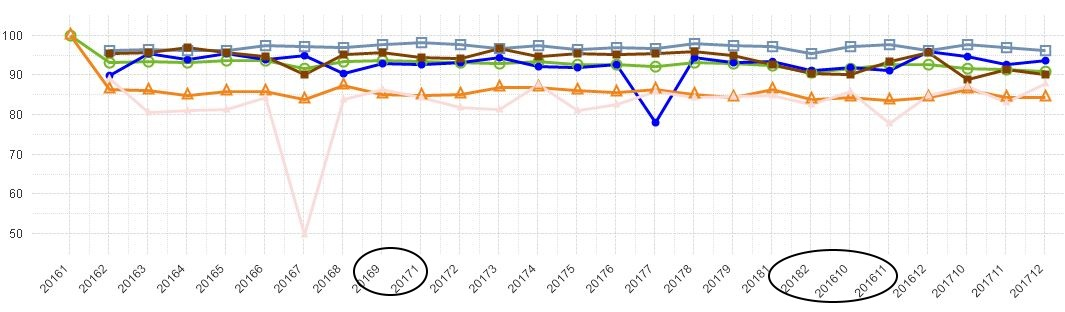
After 20169 come 20171 and after 20182 come 201610 an so on. I know this is some kind onf soting problem but how I fix it?
BR
Timo
Accepted Solutions
- Mark as New
- Bookmark
- Subscribe
- Mute
- Subscribe to RSS Feed
- Permalink
- Report Inappropriate Content
Please try with
Year (timestamp(max(EventEndDate))) *100 + Month (timestamp(max(EventEndDate)))
- Mark as New
- Bookmark
- Subscribe
- Mute
- Subscribe to RSS Feed
- Permalink
- Report Inappropriate Content
Please try with
Year (timestamp(max(EventEndDate))) *100 + Month (timestamp(max(EventEndDate)))
- Mark as New
- Bookmark
- Subscribe
- Mute
- Subscribe to RSS Feed
- Permalink
- Report Inappropriate Content
Hi,
try to set the sorting of your dimension to: numeric value ascending
and uncheck the rest
- Mark as New
- Bookmark
- Subscribe
- Mute
- Subscribe to RSS Feed
- Permalink
- Report Inappropriate Content
Use below script for Month,You will get your require result
=num(Month (timestamp(max(EventEndDate))),'00')
- Mark as New
- Bookmark
- Subscribe
- Mute
- Subscribe to RSS Feed
- Permalink
- Report Inappropriate Content
=num(Year (timestamp(max(EventEndDate))))&num(Month (timestamp(max(EventEndDate))),'00') as EventEndYearMonth
- Mark as New
- Bookmark
- Subscribe
- Mute
- Subscribe to RSS Feed
- Permalink
- Report Inappropriate Content
Thank you Clever. That Works. Also praveen's solution seems to work!