Unlock a world of possibilities! Login now and discover the exclusive benefits awaiting you.
- Qlik Community
- :
- All Forums
- :
- QlikView App Dev
- :
- Re: Specific Months and YTD as Dimension in a Hori...
- Subscribe to RSS Feed
- Mark Topic as New
- Mark Topic as Read
- Float this Topic for Current User
- Bookmark
- Subscribe
- Mute
- Printer Friendly Page
- Mark as New
- Bookmark
- Subscribe
- Mute
- Subscribe to RSS Feed
- Permalink
- Report Inappropriate Content
Specific Months and YTD as Dimension in a Horizontal Straight Table
I am currently struggling on a dimension in a horizontal straight table and I can't seem to find a solution myself or in existing Discussions.
What I want is to show 5 columns:
- OK Current Month - 2
- OK Current Month - 1
- OK Current Month
- OK Same Month as Current from Y-1
- NOK YTD
The first 4 are OK but I can't find a way to insert the YTD as column n° 5, the difficulty is of course that YTD is a calculation of more than one month. Is there any way I can insert it on the same 'level' as the months (e.g.: 2016 - YTD)?
As you can see I have 2 dimensions (I can't use Tab Expressions for DateTime because I need it to calculate a set of complex KPI's there):
- Dimension 1 Year: DateCalendar.Year, this is just a field
- Dimension 2 FinRep lay-out: =if(DateCalendar.Month >= month(today())-2 and DateCalendar.Month <= month(today()) and DateCalendar.Year = year(today())or DateCalendar.Year = year(today())-1 and DateCalendar.Month = month(today()),DateCalendar.Month)
Any ideas how I can get the YTD 2016 inside this Dimension Expression?
PS: I realise I will be stuck in January with the Month - 2 part but I will fix this later  .
.
Thanks in advance.
Accepted Solutions
- Mark as New
- Bookmark
- Subscribe
- Mute
- Subscribe to RSS Feed
- Permalink
- Report Inappropriate Content
If it's really based on the current month rather than selections, and assuming you have some sort of master calendar, I'd have some table like this:
Period,Month
Oct 2016,Oct 2016
Nov 2016,Nov 2016
Dec 2016,Dec 2016
Dec 2015,Dec 2015
YTD,Jan 2016
YTD,Feb 2016
...
YTD,Dec 2016
Month connects to your master calendar, Period is what you put in your chart to replace year and financial reporting lay-out. It will automatically create all the right sub-totals. Sort Period in load order, assuming you've loaded it in the order you want to see them.
If you want to be able to do this based on a selected month instead of the current month, then this expands into an AsOf table by adding one more field, AsOfMonth, which for the data above would be Dec 2016. Then you'd add similar data for all other AsOfMonths.
- Mark as New
- Bookmark
- Subscribe
- Mute
- Subscribe to RSS Feed
- Permalink
- Report Inappropriate Content
May be use an Island table approach with Pick() function in your expression? May be share a sample with expected output for a more detailed help
- Mark as New
- Bookmark
- Subscribe
- Mute
- Subscribe to RSS Feed
- Permalink
- Report Inappropriate Content
If it's really based on the current month rather than selections, and assuming you have some sort of master calendar, I'd have some table like this:
Period,Month
Oct 2016,Oct 2016
Nov 2016,Nov 2016
Dec 2016,Dec 2016
Dec 2015,Dec 2015
YTD,Jan 2016
YTD,Feb 2016
...
YTD,Dec 2016
Month connects to your master calendar, Period is what you put in your chart to replace year and financial reporting lay-out. It will automatically create all the right sub-totals. Sort Period in load order, assuming you've loaded it in the order you want to see them.
If you want to be able to do this based on a selected month instead of the current month, then this expands into an AsOf table by adding one more field, AsOfMonth, which for the data above would be Dec 2016. Then you'd add similar data for all other AsOfMonths.
- Mark as New
- Bookmark
- Subscribe
- Mute
- Subscribe to RSS Feed
- Permalink
- Report Inappropriate Content
Hi John
Thank you for your useful and lean answer. I created an infeed table linked to my master calendar:
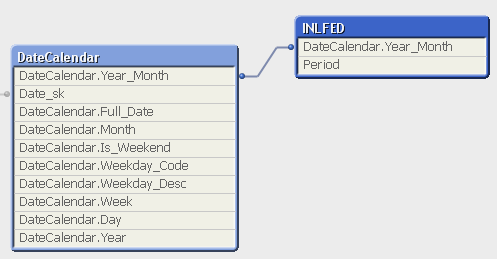
and adapted dimension expression:
=if(left(Period,3)<> 'YTD', if(DateCalendar.Month >= month(today())-2 and DateCalendar.Month <= month(today()) and DateCalendar.Year = year(today()) or DateCalendar.Month = month(today()) and DateCalendar.Year = year(today())-1,Period),if(right(Period,4) = year(today()),Period))
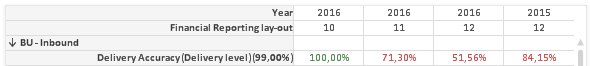
My table now looks like this:

Thanks!