Unlock a world of possibilities! Login now and discover the exclusive benefits awaiting you.
- Qlik Community
- :
- All Forums
- :
- QlikView App Dev
- :
- Stacked Chart - Custom Coloring
- Subscribe to RSS Feed
- Mark Topic as New
- Mark Topic as Read
- Float this Topic for Current User
- Bookmark
- Subscribe
- Mute
- Printer Friendly Page
- Mark as New
- Bookmark
- Subscribe
- Mute
- Subscribe to RSS Feed
- Permalink
- Report Inappropriate Content
Stacked Chart - Custom Coloring
Hello,
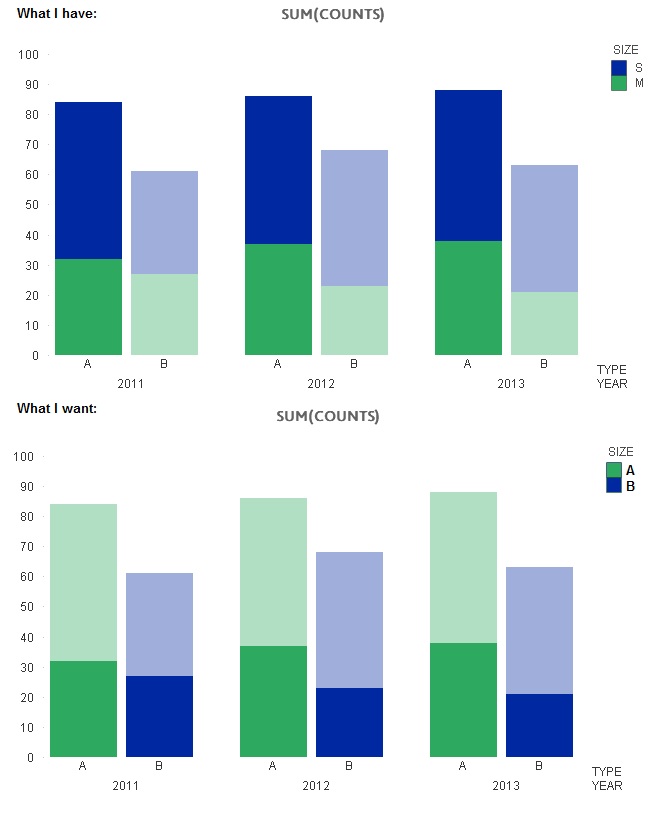
So I found this wonderful trick (Qlikview Notes: A Color Trick) to change the color of some of the stacked bar charts to be lighter. However, what I really want to do is have seperate colors for TYPE (A,B) and then lighten SIZE (S,M). See image below.
Any ideas?
Thanks!

Accepted Solutions
- Mark as New
- Bookmark
- Subscribe
- Mute
- Subscribe to RSS Feed
- Permalink
- Report Inappropriate Content
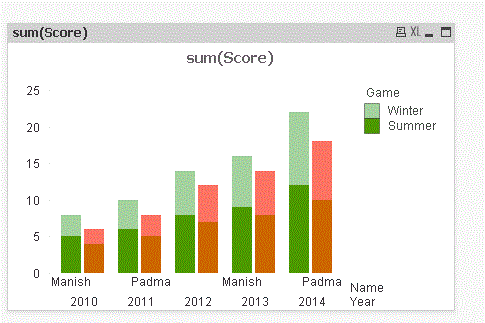
Hi
if(Name = 'Manish' and Game='Summer', rgb(76,153,0),
if(Name = 'Manish' and Game='Winter',argb(96,76,153,0)bitand Color(FieldIndex('Game',Game)),
if(Name = 'Padma' and Game='Summer', rgb(204,102,0),
if(Name = 'Padma' and Game='Summer', argb(96,204,102,0) bitand Color(FieldIndex('Game',Game))
))))
tyring to figure out how to attach a sample file

Regards
Padma
- Mark as New
- Bookmark
- Subscribe
- Mute
- Subscribe to RSS Feed
- Permalink
- Report Inappropriate Content
Hi
if(Name = 'Manish' and Game='Summer', rgb(76,153,0),
if(Name = 'Manish' and Game='Winter',argb(96,76,153,0)bitand Color(FieldIndex('Game',Game)),
if(Name = 'Padma' and Game='Summer', rgb(204,102,0),
if(Name = 'Padma' and Game='Summer', argb(96,204,102,0) bitand Color(FieldIndex('Game',Game))
))))
tyring to figure out how to attach a sample file

Regards
Padma
- Mark as New
- Bookmark
- Subscribe
- Mute
- Subscribe to RSS Feed
- Permalink
- Report Inappropriate Content
Hi
if(Name = 'Manish' and Game='Summer', rgb(76,153,0),
if(Name = 'Manish' and Game='Winter',argb(96,76,153,0)bitand Color(FieldIndex('Game',Game)),
if(Name = 'Padma' and Game='Summer', rgb(204,102,0),
if(Name = 'Padma' and Game='Summer', argb(96,204,102,0) bitand Color(FieldIndex('Game',Game))
))))
Please find attached sample file
Regards
Padma
- Mark as New
- Bookmark
- Subscribe
- Mute
- Subscribe to RSS Feed
- Permalink
- Report Inappropriate Content
Hi
This is a long winded code, i am trying is there a better way of doing this
May using variables
Regards
Padma
- Mark as New
- Bookmark
- Subscribe
- Mute
- Subscribe to RSS Feed
- Permalink
- Report Inappropriate Content
Hi Padma/Jaro,
I have seen the color trick mentioned earlier.
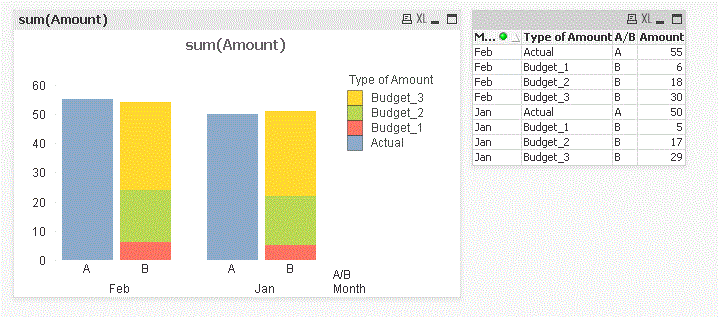
I have a requirement, comparing Actual vs Budget per month. so I created a grouped bar chart for actual and budget bars, but Budget is still devided into 3 parts namely, Budget_1,Budget_2,Budget_3.
How can I show, Budget with the 3 parts comparing to Actuals in a single barchart??
attaching sample data here.
- Mark as New
- Bookmark
- Subscribe
- Mute
- Subscribe to RSS Feed
- Permalink
- Report Inappropriate Content
Hi Nuthan
You have to transpose the data
please see the table in the snap shot
Regards
Padma

- Mark as New
- Bookmark
- Subscribe
- Mute
- Subscribe to RSS Feed
- Permalink
- Report Inappropriate Content
Thank you Padma. It works fine.
- Mark as New
- Bookmark
- Subscribe
- Mute
- Subscribe to RSS Feed
- Permalink
- Report Inappropriate Content
Hi jaro can u pl mark this answer
thanks and regards
padma