Unlock a world of possibilities! Login now and discover the exclusive benefits awaiting you.
- Qlik Community
- :
- All Forums
- :
- QlikView App Dev
- :
- Stacked and Grouped in a single bar chart?
- Subscribe to RSS Feed
- Mark Topic as New
- Mark Topic as Read
- Float this Topic for Current User
- Bookmark
- Subscribe
- Mute
- Printer Friendly Page
- Mark as New
- Bookmark
- Subscribe
- Mute
- Subscribe to RSS Feed
- Permalink
- Report Inappropriate Content
Stacked and Grouped in a single bar chart?
Hello,
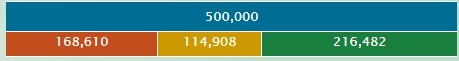
Can we present one expression as a single bar and two other expressions as stacked in a single chart?
Something like this.
- « Previous Replies
-
- 1
- 2
- Next Replies »
- Mark as New
- Bookmark
- Subscribe
- Mute
- Subscribe to RSS Feed
- Permalink
- Report Inappropriate Content
Script
Table:
CrossTable(Color, Value)
LOAD * INLINE [
Name_State, Red, Green, Yellow
Region 1, 1999, 4068, 1933
Region 2, 14148, 11063, 0
Region 3, 574, 4335, 3091
Region 4, 14506, 2368, 1126
Region 5, 11809, 22999, 12192
Region 6, 571, 4586, 3843
Region 7, 11430, 4922, 20648
Region 8, 9418, 25718, 0
Region 9, 2092, 6038, 5870
Region 10, 6689, 22687, 71624
Region 11, 12590, 41490, 6920
Region 12, 9336, 48555, 51109
Region 13, 19740, 17647, 3613
];
Dim:
LOAD * Inline [
Dim
1
2
];
Dimension
Dim
=Pick(Dim, Color, 'Blue')
Expression
=Sum(Value)
Background Color expression
=If(Dim = 1, If(Color = 'Yellow', Yellow(), If(Color = 'Red', LightRed(), If(Color = 'Green', LightGreen(), LightBlue()))), LightBlue())
- Mark as New
- Bookmark
- Subscribe
- Mute
- Subscribe to RSS Feed
- Permalink
- Report Inappropriate Content
Thank you all for your timely help. You guys are great.
See you soon with another question 
- Mark as New
- Bookmark
- Subscribe
- Mute
- Subscribe to RSS Feed
- Permalink
- Report Inappropriate Content
Hey,
Thanks much.
- « Previous Replies
-
- 1
- 2
- Next Replies »