Unlock a world of possibilities! Login now and discover the exclusive benefits awaiting you.
- Qlik Community
- :
- All Forums
- :
- QlikView App Dev
- :
- Re: Stacked chart with calculated cycle
- Subscribe to RSS Feed
- Mark Topic as New
- Mark Topic as Read
- Float this Topic for Current User
- Bookmark
- Subscribe
- Mute
- Printer Friendly Page
- Mark as New
- Bookmark
- Subscribe
- Mute
- Subscribe to RSS Feed
- Permalink
- Report Inappropriate Content
Stacked chart with calculated cycle
Hi!
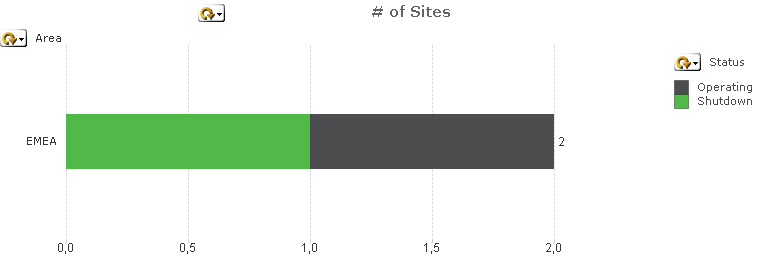
I'm trying to create a chart that shows the number of sites divided by their status. The thing is that one site has multiple machines and the status comes from the machines so one site might have multiple statuses. The problem is shown in the picture. There is only one site in the picture but because it has to statuses the chart shows that their is two sites. Is there an expression I could use or some other way to create this kind of view so that the total amount of sites wouldn't be duplicated but all the statuses would show? I would like it still to be like this horizontally.
At the moment the expression of the chart is just COUNT(DISTINCT([Site Code])).
Thanks for your help!
Regards,
Heidi
- Mark as New
- Bookmark
- Subscribe
- Mute
- Subscribe to RSS Feed
- Permalink
- Report Inappropriate Content
Hi Heidi, if one site has two machines, one operating and one shutdown, wich status should count? or it is 0,5 for each status?
- Mark as New
- Bookmark
- Subscribe
- Mute
- Subscribe to RSS Feed
- Permalink
- Report Inappropriate Content
0,5 for each! But some sites might have even more than two status..
- Mark as New
- Bookmark
- Subscribe
- Mute
- Subscribe to RSS Feed
- Permalink
- Report Inappropriate Content
if i understand your question correctly, you need the expression below:
Count(DISTINCT [Site Code])/Count(TOTAL <[Site Code]> DISTINCT Status)
replace your current expression with above expression and see if that is what you need. of course, modify as you see fit for your field names.
- Mark as New
- Bookmark
- Subscribe
- Mute
- Subscribe to RSS Feed
- Permalink
- Report Inappropriate Content
Didn't help. The site is still shown as two. I want the x-axes to show one if there is only one site selected (as is selected in the picture), and the bar to be divided between the statuses.
- Mark as New
- Bookmark
- Subscribe
- Mute
- Subscribe to RSS Feed
- Permalink
- Report Inappropriate Content
may be a sample data set will help as i have a couple of questions - what is your dimension - Area? How is Area related to Site Code? that's why i said you may have to modify the expression to match your fields.
- Mark as New
- Bookmark
- Subscribe
- Mute
- Subscribe to RSS Feed
- Permalink
- Report Inappropriate Content
Try:
Sum(Aggr(Count(DISTINCT Site)/count(TOTAL <Area, Site> Machine) ,Area, Site, State))
In a simple sample works for me.
You need to change "Site", "Area" and "State" for your name fields
- Mark as New
- Bookmark
- Subscribe
- Mute
- Subscribe to RSS Feed
- Permalink
- Report Inappropriate Content
Hi
I have doubt that , i didn't clearly get your requirement. But i think below will solve your problem.