Unlock a world of possibilities! Login now and discover the exclusive benefits awaiting you.
- Qlik Community
- :
- All Forums
- :
- QlikView App Dev
- :
- Staright table to show current year and previous y...
- Subscribe to RSS Feed
- Mark Topic as New
- Mark Topic as Read
- Float this Topic for Current User
- Bookmark
- Subscribe
- Mute
- Printer Friendly Page
- Mark as New
- Bookmark
- Subscribe
- Mute
- Subscribe to RSS Feed
- Permalink
- Report Inappropriate Content
Staright table to show current year and previous year sales
Hi,
Is it possible to show sales for a year and sales for the previous year in a straight table without using above() function?
My data is like:
Year, Sales
2011, 1000
2012, 2000
2013, 3000
2014, 4000
2015, 5000
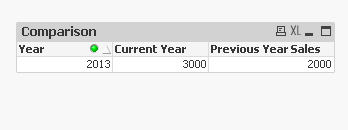
And I want the chart to look like
Year, Sales, Previous_Year
2011, 1000,
2012, 2000, 1000
2013, 3000, 2000
2014, 4000, 3000
2015, 5000, 4000
I was able to achieve it using above() function but when filters are applied (like when only few years are selected, the first one is always missing Previous_Year value), the above() is not working as expected.
Attaching a sample file. Any help would be greatly appreciated.
Accepted Solutions
- Mark as New
- Bookmark
- Subscribe
- Mute
- Subscribe to RSS Feed
- Permalink
- Report Inappropriate Content
I know you found your solution, but just so you want the Above function solution, you can use this expression:
If(Sum(Sales) > 0, Above(Sum({<Year>}Sales)))
- Mark as New
- Bookmark
- Subscribe
- Mute
- Subscribe to RSS Feed
- Permalink
- Report Inappropriate Content
Hi,
If anyone is interested, I was able to achieve this with a bit of scripting code. Sample attached.
-- Malai !
- Mark as New
- Bookmark
- Subscribe
- Mute
- Subscribe to RSS Feed
- Permalink
- Report Inappropriate Content
I know you found your solution, but just so you want the Above function solution, you can use this expression:
If(Sum(Sales) > 0, Above(Sum({<Year>}Sales)))
- Mark as New
- Bookmark
- Subscribe
- Mute
- Subscribe to RSS Feed
- Permalink
- Report Inappropriate Content
Your expression works as expected. Thanks a lot! This is actually better than my solution and that made life easier for me 