Unlock a world of possibilities! Login now and discover the exclusive benefits awaiting you.
- Qlik Community
- :
- All Forums
- :
- QlikView App Dev
- :
- Re: Statistically clean data in dashboard
- Subscribe to RSS Feed
- Mark Topic as New
- Mark Topic as Read
- Float this Topic for Current User
- Bookmark
- Subscribe
- Mute
- Printer Friendly Page
- Mark as New
- Bookmark
- Subscribe
- Mute
- Subscribe to RSS Feed
- Permalink
- Report Inappropriate Content
Statistically clean data in dashboard
Hello Everyone,
I am new to the world of Qlikview, and right now I am enjoying it. My current dashboard involves analyzing user provided data, which of course provides its own challenges with respect to quality.
My question is, is there a way to clean the data using statistics, for instance, removing any data more the X std dev away?
- Mark as New
- Bookmark
- Subscribe
- Mute
- Subscribe to RSS Feed
- Permalink
- Report Inappropriate Content
Welcome & All the best !
yes you can....but describe more about your problem with data.(QVW).
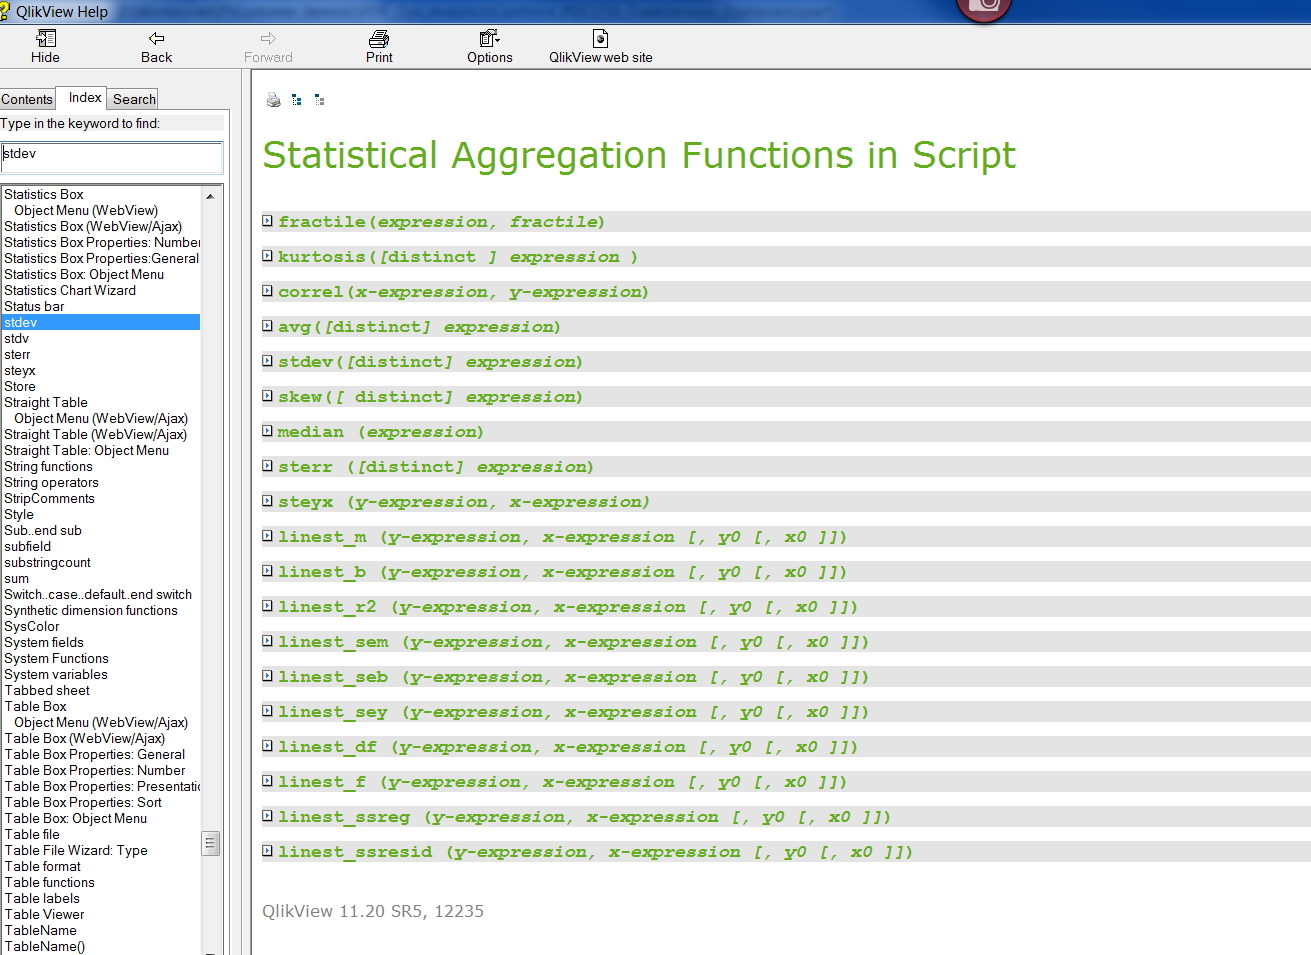
Have look Statistics functions.

- Mark as New
- Bookmark
- Subscribe
- Mute
- Subscribe to RSS Feed
- Permalink
- Report Inappropriate Content
See this example in the QV Cookbook
http://qlikviewcookbook.com/recipes/download-info/outliers/
for an example of removing outliers from a chart.
-Rob
- Mark as New
- Bookmark
- Subscribe
- Mute
- Subscribe to RSS Feed
- Permalink
- Report Inappropriate Content
My app concerns showing a competitive pricing database's information. This information is supplied by salespeople in the field. So lets say my company deals with widgets and the average price of a widget is $1,000.00. Some users have put in erroneous information, for example, a widget that costs $1.00 or $1MM. These records are clearly the result of user error but enough of these errors will skew the data and can lead to bad decisions. My goal is to use statistics and say "If the price of a widget is X standard deviations from the mean, remove/hide it from the usable/viewable data set".
Thanks for your help.