Unlock a world of possibilities! Login now and discover the exclusive benefits awaiting you.
- Qlik Community
- :
- All Forums
- :
- QlikView App Dev
- :
- Re: Re: Re: Straight Table chart with linear gauge...
- Subscribe to RSS Feed
- Mark Topic as New
- Mark Topic as Read
- Float this Topic for Current User
- Bookmark
- Subscribe
- Mute
- Printer Friendly Page
- Mark as New
- Bookmark
- Subscribe
- Mute
- Subscribe to RSS Feed
- Permalink
- Report Inappropriate Content
Straight Table chart with linear gauge chart
Hi,
I have attached qvw which has bar chart in straight table chart.
I want to use linear gauge chart instead of bar for the same field.
Need your help on this as unable to show linear gauge chart.
Thanks,
- « Previous Replies
-
- 1
- 2
- Next Replies »
- Mark as New
- Bookmark
- Subscribe
- Mute
- Subscribe to RSS Feed
- Permalink
- Report Inappropriate Content
Hi,
Because 14 is very small value when compared to 7287, that's why it is not visible. If you increase the width of the Linear gauge column you can view that.
Regards,
Jagan.
- Mark as New
- Bookmark
- Subscribe
- Mute
- Subscribe to RSS Feed
- Permalink
- Report Inappropriate Content
Hi Jagan,
I am trying to do exactly the same that you show in your printscreen, but I would need to add some colour coding to the bars. My data is normalized to percentages, so I simply need to color code the bars on 3 different colors : Green from 0 to 90% , Yellow from 91% to 100% and Red for % higher than 100%.
I am trying to apply some nested if statements for this ( as it seems the color of the bar allows a calculated condition ), but for whatever reason it does not work.
See below screen clips...any idea of what could be rong here ?
Gauge properties : you can see here the color button for the Lower Bound has an f(x) label ( indicating a calculated condition is setup in the background )
Clicking on the color button :
Then, this is the nested if statement in the expression :
Unfortunately these are workarounds to overcome the limitation of Qlikview not having bullet charts out of the box , or not being able for example to display a thinner bar inside a wider bar , kind of a temp meter display for my setup above ( rather than showing 2 bars side by side )
Any ideas are appreciated.
Thanks
Enrique
- Mark as New
- Bookmark
- Subscribe
- Mute
- Subscribe to RSS Feed
- Permalink
- Report Inappropriate Content
Hi Jagan Mohan,
I like the linear gauge presentation in the qvw you have posted. I am trying to recreate the linear gauge style with the pipes in the background and a smaller green bars. Could you please tell me how you were able to get that style?
- Mark as New
- Bookmark
- Subscribe
- Mute
- Subscribe to RSS Feed
- Permalink
- Report Inappropriate Content
Hi Shruti,
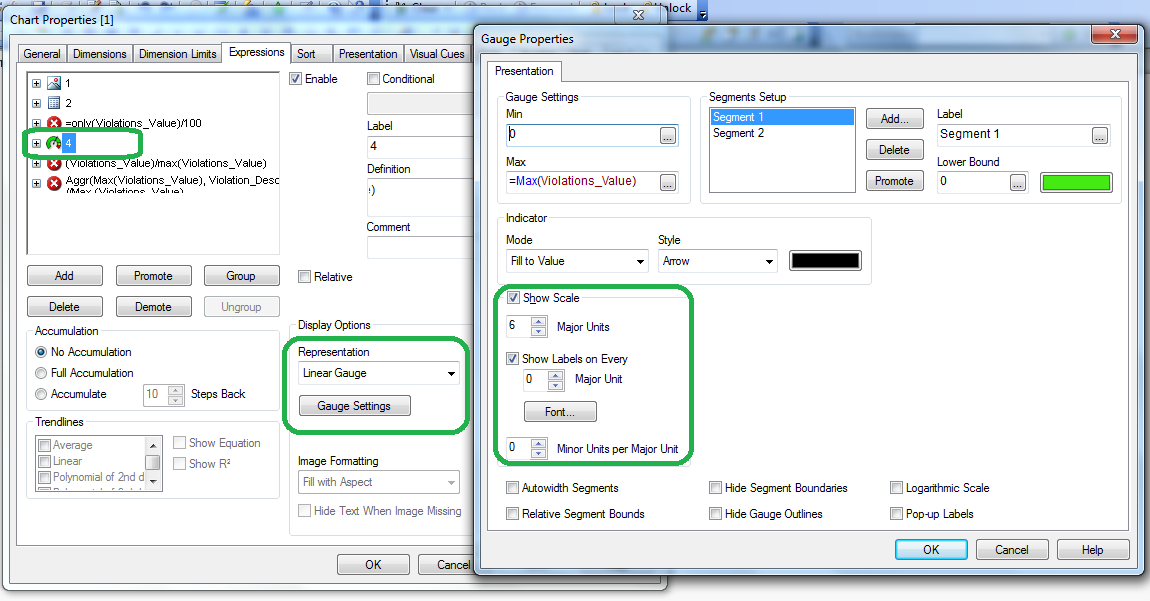
Check this screenshot

Regards,
Jagan.
- Mark as New
- Bookmark
- Subscribe
- Mute
- Subscribe to RSS Feed
- Permalink
- Report Inappropriate Content
Thank you so much for the screenshot Jagan!
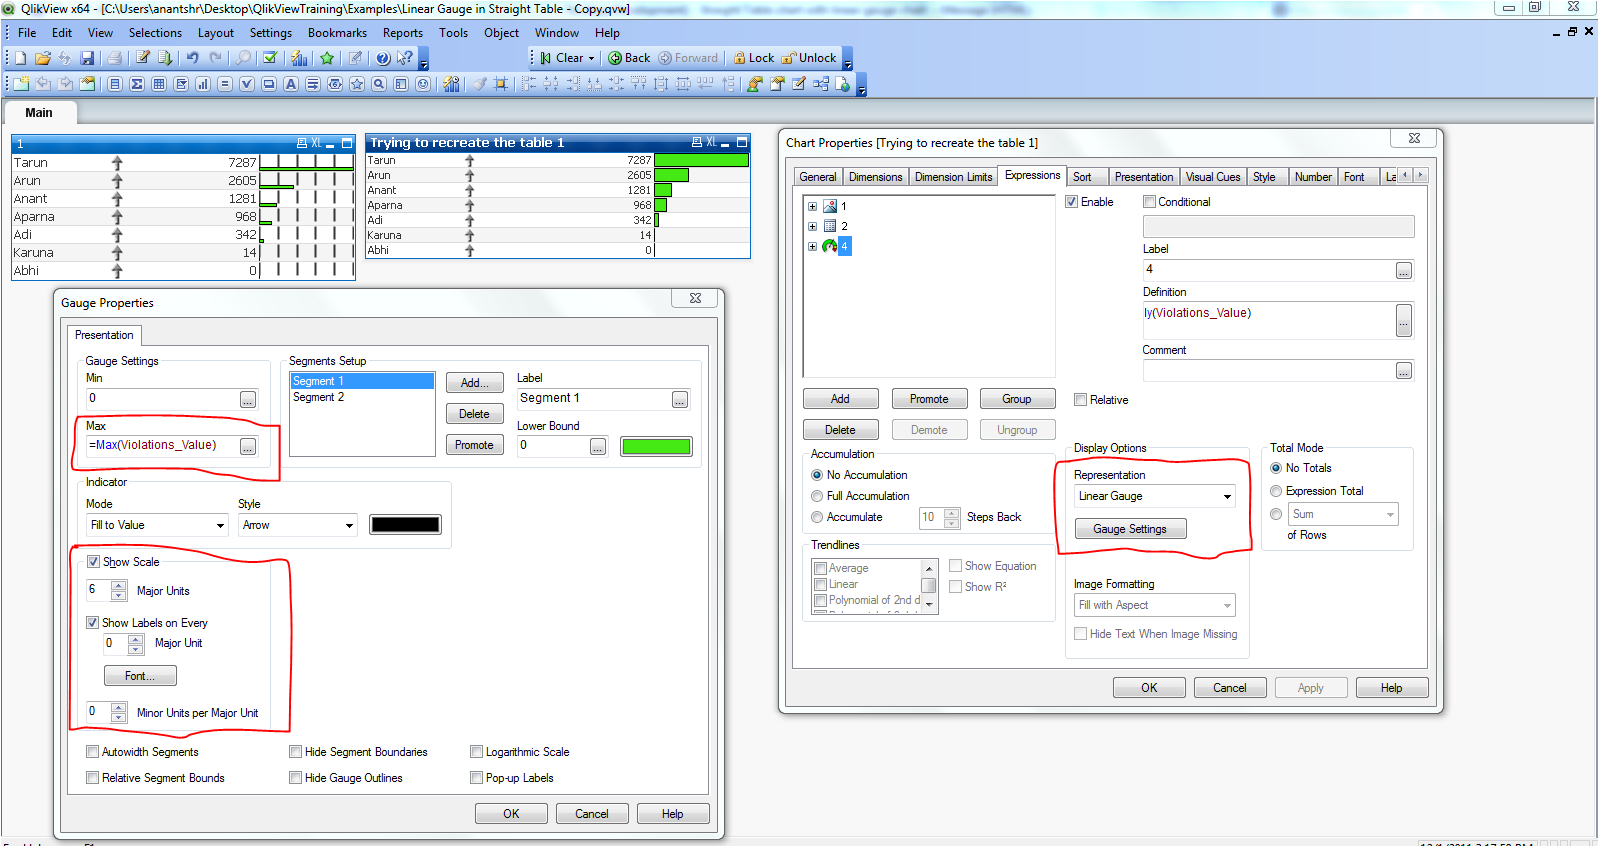
But I have tried to do exactly like you have in your qvw file, and still can't get the pipes behind the bars.
Please find attached the screenshot and the qvw file itself. The first chart is your chart and the second one is what I am trying to recreate.
Appreciate your help.

- Mark as New
- Bookmark
- Subscribe
- Mute
- Subscribe to RSS Feed
- Permalink
- Report Inappropriate Content
Hi Shruthi ,
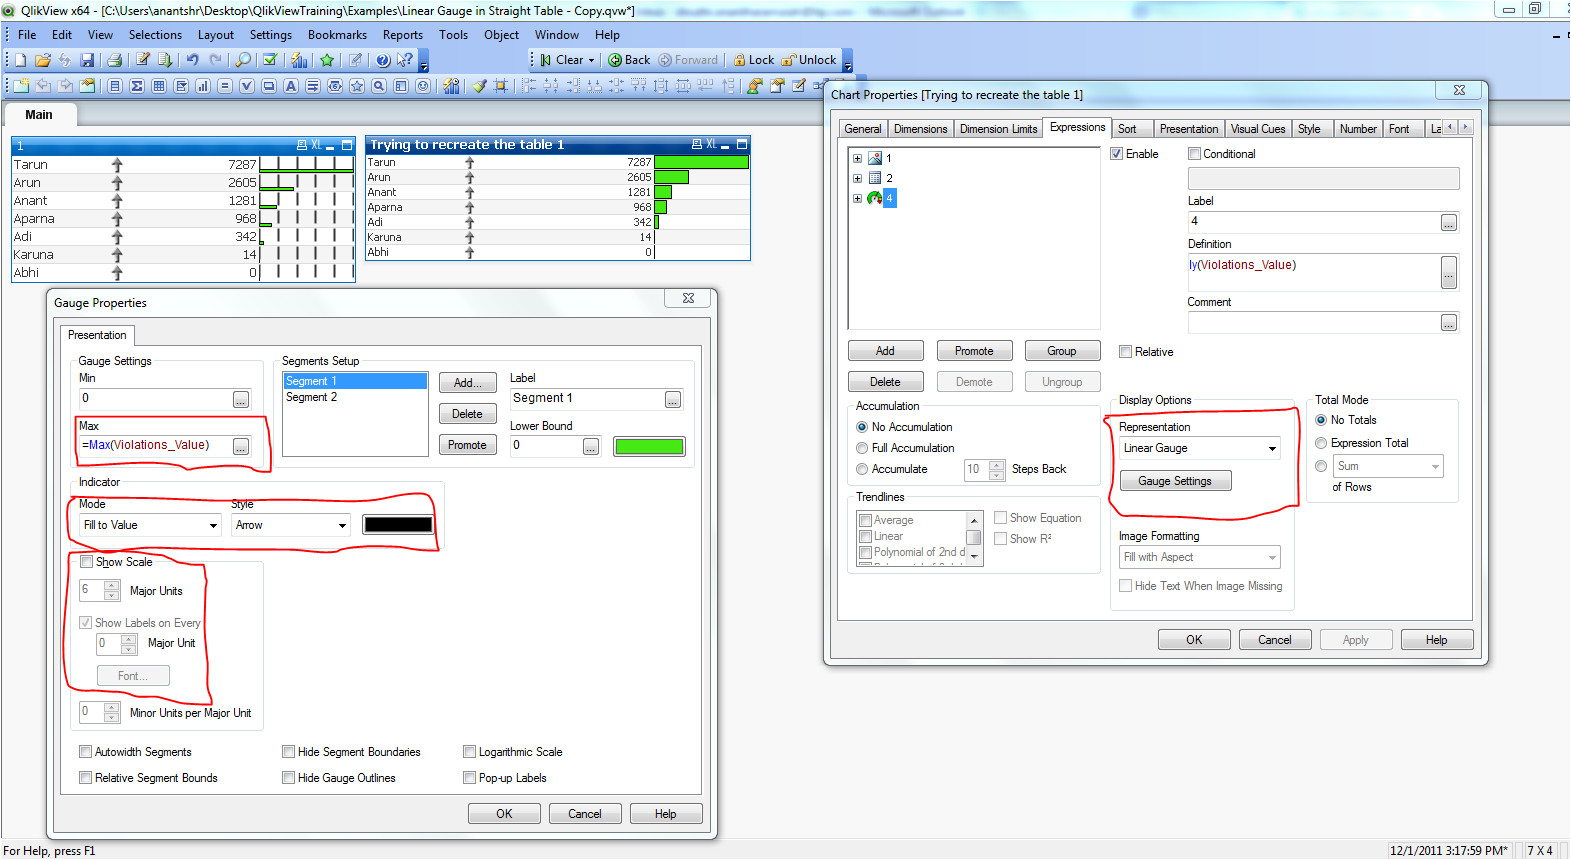
Uncheck the Show Scale and Show labels on Every ..
Pls refer screenshot
- Mark as New
- Bookmark
- Subscribe
- Mute
- Subscribe to RSS Feed
- Permalink
- Report Inappropriate Content
Thanks Senthil,
I have tried both checking and unchecking them They are just the same ![]() .. Please find the qvw file attached and the screenshot.
.. Please find the qvw file attached and the screenshot.
Please let me know if you are able to recreate the same style in the second chart.

- Mark as New
- Bookmark
- Subscribe
- Mute
- Subscribe to RSS Feed
- Permalink
- Report Inappropriate Content
Hi,
I Created the same chart with the settings attached in screenshot. Please find attached file with new chart.
Regards,
Jagan.
- Mark as New
- Bookmark
- Subscribe
- Mute
- Subscribe to RSS Feed
- Permalink
- Report Inappropriate Content
Thanks Jagan and Senthil,
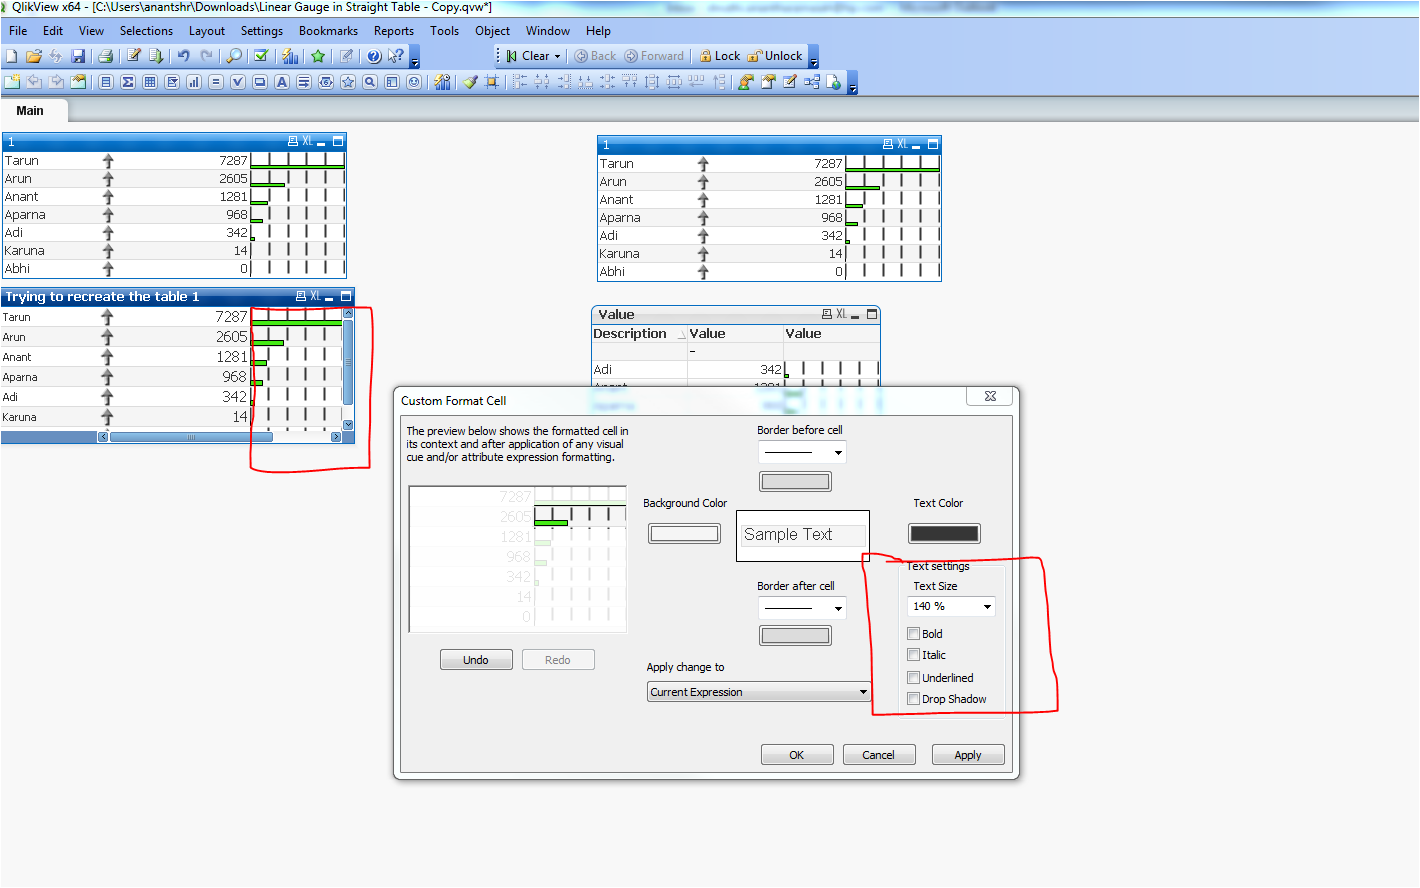
I finally got the anser to this and it worked when I increased the Text size to 140% under "Custom Format Cell". You would get to Custom Format cell by right clicking on that Column of the chart. The lines will go away as soon as you make the text size 100% ![]()
Please find attached the screenshot.

- Mark as New
- Bookmark
- Subscribe
- Mute
- Subscribe to RSS Feed
- Permalink
- Report Inappropriate Content
does anybody know why the calculated base color expression on the gauge does not work ? its color should change based on the nested if statement ( grenn, yellow, red ).
thanks !!
- « Previous Replies
-
- 1
- 2
- Next Replies »