Unlock a world of possibilities! Login now and discover the exclusive benefits awaiting you.
- Qlik Community
- :
- All Forums
- :
- QlikView App Dev
- :
- Re: Straight table with "artificial" column for ma...
- Subscribe to RSS Feed
- Mark Topic as New
- Mark Topic as Read
- Float this Topic for Current User
- Bookmark
- Subscribe
- Mute
- Printer Friendly Page
- Mark as New
- Bookmark
- Subscribe
- Mute
- Subscribe to RSS Feed
- Permalink
- Report Inappropriate Content
Straight table with "artificial" column for market penetration
Hi,
I would like to create a table which shows the market penetration of my company's product based on the annual revenue of the client company. For example, if i have closed a deal with Subsidiary A1(Annual Revenue of 2000) and A2(Annual Revenue of 1000) but failed to close a deal with A3(4000), I would have achieved a penetration of 42.8% (3000/7000) of HQ A.
How should I go about creating column ⑤and ⑥?
I have uploaded a sample file as well.
Thanks!

- Tags:
- new_to_qlikview
Accepted Solutions
- Mark as New
- Bookmark
- Subscribe
- Mute
- Subscribe to RSS Feed
- Permalink
- Report Inappropriate Content
Hi Minghui, PFA.
- Mark as New
- Bookmark
- Subscribe
- Mute
- Subscribe to RSS Feed
- Permalink
- Report Inappropriate Content
Hi Minghui,
Is it helpful for u?
Here i am using pivot table

for the sub total
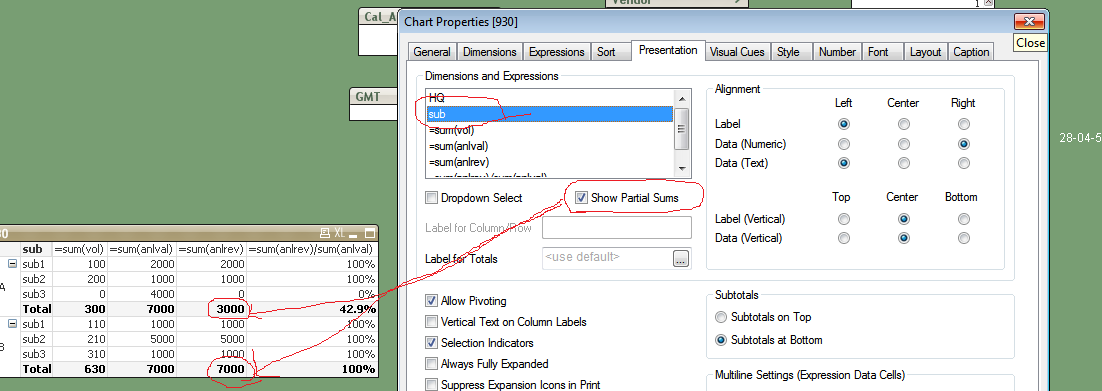
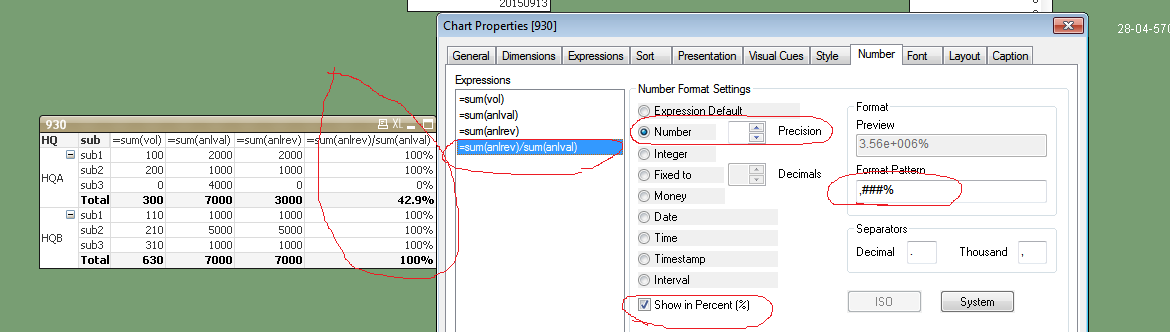
for the percentage of 6th column
- Mark as New
- Bookmark
- Subscribe
- Mute
- Subscribe to RSS Feed
- Permalink
- Report Inappropriate Content
Hi Minghui, PFA.
- Mark as New
- Bookmark
- Subscribe
- Mute
- Subscribe to RSS Feed
- Permalink
- Report Inappropriate Content
Great help! The aggr() function which you used was extremely helpful to achieve what i wanted to.
- Mark as New
- Bookmark
- Subscribe
- Mute
- Subscribe to RSS Feed
- Permalink
- Report Inappropriate Content
Thank you for the help!