Unlock a world of possibilities! Login now and discover the exclusive benefits awaiting you.
- Qlik Community
- :
- All Forums
- :
- QlikView App Dev
- :
- Re: Sum of Flag where distinct column
- Subscribe to RSS Feed
- Mark Topic as New
- Mark Topic as Read
- Float this Topic for Current User
- Bookmark
- Subscribe
- Mute
- Printer Friendly Page
- Mark as New
- Bookmark
- Subscribe
- Mute
- Subscribe to RSS Feed
- Permalink
- Report Inappropriate Content
Sum of Flag where distinct column
Hi,
I am trying to sum a flag which i have made for each distinct value in a column called EQUNR within a graph.
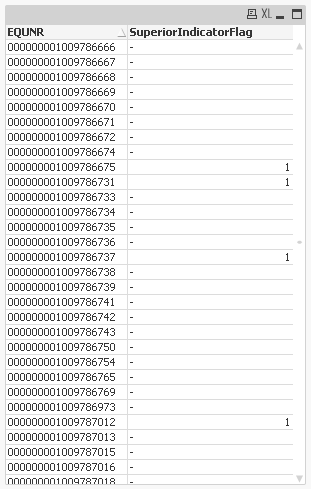
In the below code, i am trying to create the above graph with the aggr function and then sum up the SuperiorIndicatorFlag. EQUNR is not unique for every row, so i think i need to use the disctinct function.
Here is my code:
sum(Aggr(distinct EQUNR,SuperiorIndicatorFlag))
for some reason, my graph shows 'No data to display'
Any help would be greatly appreciated.
Accepted Solutions
- Mark as New
- Bookmark
- Subscribe
- Mute
- Subscribe to RSS Feed
- Permalink
- Report Inappropriate Content
Matt, if you add this expression, are you getting numbers greater than 1 for the superior indicator flag ?
sum( SuperiorIndicatorFlag)
If yes , you can try
sum( aggr( max( SuperiorIndicatorFlag) , EQUNR) )
...aggregates the highest value ( 1 or nothing) for each EQUNR, then sums up the results.