Unlock a world of possibilities! Login now and discover the exclusive benefits awaiting you.
- Qlik Community
- :
- All Forums
- :
- QlikView App Dev
- :
- Re: Sum product
- Subscribe to RSS Feed
- Mark Topic as New
- Mark Topic as Read
- Float this Topic for Current User
- Bookmark
- Subscribe
- Mute
- Printer Friendly Page
- Mark as New
- Bookmark
- Subscribe
- Mute
- Subscribe to RSS Feed
- Permalink
- Report Inappropriate Content
Sum product
Hi Team,
I am new to QLIK view, trying to develop my own dashboard. I am struck with Sum product formula, let me explain my case.
I have each market wise cost and volume, i want to know the overall Region cost. I have given below the sample data. In excel i will write formula as =sum product(Cost,Volume)/Total Volumes. please try to translate it to expression in QLIkview
| Region | Cost | Volumes |
| Dubai | 1,000.00 | 2000 |
| Israel | - | 0 |
| Northern Africa | 2,000.00 | 8000 |
| Southern Africa | 3,000.00 | 120000 |
| Other Africa | 4,000.00 | 20000 |
| Middle East & Africa Total | 3,053.33 | 150000 |
- « Previous Replies
- Next Replies »
- Mark as New
- Bookmark
- Subscribe
- Mute
- Subscribe to RSS Feed
- Permalink
- Report Inappropriate Content
You have helped me on Per unit which is one of the item in the cyclic view, now i need your help for % which is another item in the same cyclic view.
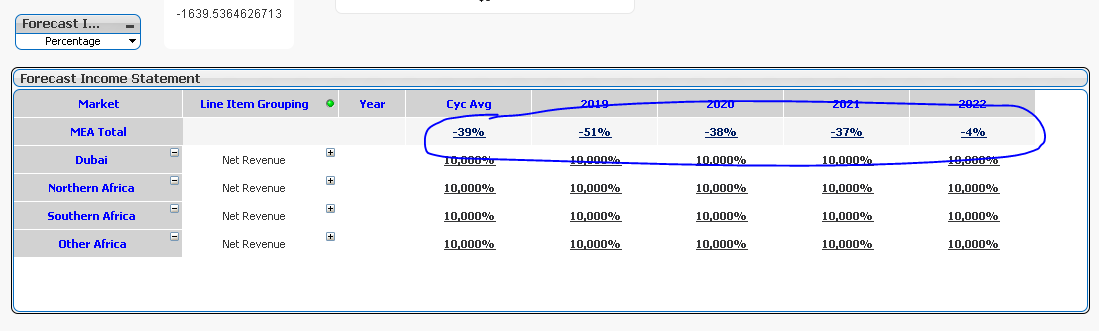
My expected number on MEA Total for Percentage (In cyclic view) are listed below.
| Cycle Average | 2022 | 2021 | 2020 | 2019 | ||||||
| In $ Mils | Ops margin (In %) | In $ Mils | Ops margin (In %) | In $ Mils | Ops margin (In %) | In $ Mils | Ops margin (In %) | In $ Mils | Ops margin (In %) | |
| Dubai | 21 | (36.05) | 35 | 29.51 | 20 | (53.48) | 13 | (71.75) | 5 | (154.93) |
| Israel | - | - | - | - | - | - | - | - | - | - |
| Northern Africa | 28 | 19.61 | 37 | 34.03 | 30 | 37.85 | 19 | 31.73 | 11 | 18.82 |
| Southern Africa | 96 | (63.01) | 127 | (26.31) | 92 | (59.56) | 63 | (45.44) | 44 | (50.69) |
| Other Africa | 21 | (8.79) | 34 | 1.60 | 22 | (29.71) | 12 | (71.32) | 6 | (108.33) |
| Cycle Average Maring | -39% | -4% | -37% | -38% | -51% | |||||
- Mark as New
- Bookmark
- Subscribe
- Mute
- Subscribe to RSS Feed
- Permalink
- Report Inappropriate Content
Try this
If(Dimensionality() = 2,
Sum([In %]),
Sum(Aggr(Sum({<[Line Item Grouping] = {'Net Revenue'}>}[In $ Mils]) * sum({<[Line Item Grouping] = {'Operating Margin'}>}[In %]), Market, Year))
/Sum({<[Line Item Grouping] = {'Net Revenue'}>}[In $ Mils])/100)
- Mark as New
- Bookmark
- Subscribe
- Mute
- Subscribe to RSS Feed
- Permalink
- Report Inappropriate Content
Is this the same thing as the example you posted below?
- Mark as New
- Bookmark
- Subscribe
- Mute
- Subscribe to RSS Feed
- Permalink
- Report Inappropriate Content
Yes exactly the same. This really works very well...Thank you so much. I also wanted to know one another thing whether that is feasible in QLIK view?
For eg, the current numbers is March'18 data, and there are few line items have got some incremental number to March data. Is it something that QLIK view can create a log saying the impact based on March Profit Margin.
Net Revenue is 100, Admin 10, Contribution Margin 40 which gives the Operating margin of 30% - March Data
Net Revenue is 100, Admin is 12, Contribution is 44 - April Data.
I want to know how much Impact of 2 Mils has impacted the Operating Margin.
Currently we are doing it manually and identifying it through excel.
- Mark as New
- Bookmark
- Subscribe
- Mute
- Subscribe to RSS Feed
- Permalink
- Report Inappropriate Content
I am not sure I follow this 100%, would you be able to elaborate with an Excel file may be showing what you do?
- « Previous Replies
- Next Replies »