Unlock a world of possibilities! Login now and discover the exclusive benefits awaiting you.
- Qlik Community
- :
- All Forums
- :
- QlikView App Dev
- :
- Re: Total with set analysis - not working properly
- Subscribe to RSS Feed
- Mark Topic as New
- Mark Topic as Read
- Float this Topic for Current User
- Bookmark
- Subscribe
- Mute
- Printer Friendly Page
- Mark as New
- Bookmark
- Subscribe
- Mute
- Subscribe to RSS Feed
- Permalink
- Report Inappropriate Content
TOTAL with set analysis - not working properly
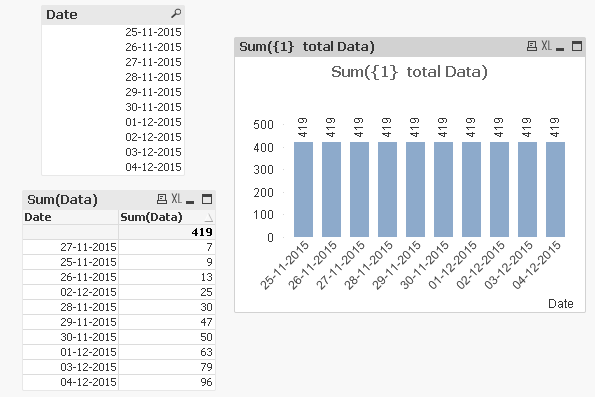
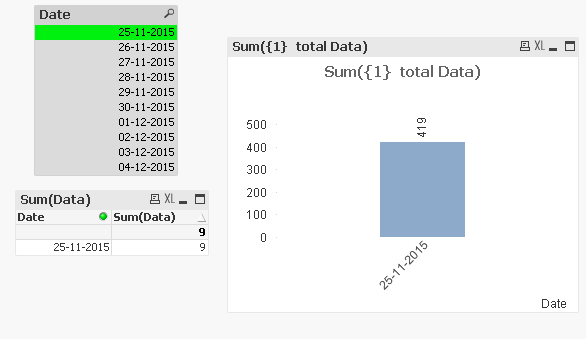
I was working on a post and re-validating the behavior of the expression creating a test application. Expression, Sum({1} Total Data) should not get affected by any selection (I guess I am not greatly mistaken). But out of the blue, when I tested the selection made an effect. Check the screen shots. I am using QV 11.2 SR 12. Could you guys please check if you see the same behavior? Please mention your versions while stating the test result. However, if I remove Total from the expression, it works as expected.


Attached the sample qvw. Could this be a bug?
- Tags:
- total
Accepted Solutions
- Mark as New
- Bookmark
- Subscribe
- Mute
- Subscribe to RSS Feed
- Permalink
- Report Inappropriate Content
No, it's not a bug. It is expected behaviour, and in my mind the best solution.
The reason is that the "Total" qualifier makes the engine treat the aggregation like a constant in the hypercube. It does not make sense to create an entire cube (all combinations of all dimensions) and then fill it with the same number. Hence, an expression with "Total" is not used to determine which rows to show in the chart. Further, when you use the "Total" qualifier, you indeed use it like a constant.
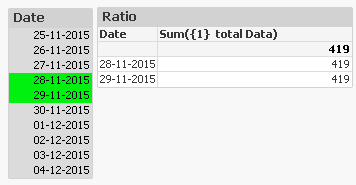
The best way to explain this is probably by an example. In the picture below, I use the "Total" qualifier to calculate a percentage (see column header to the right) - a type of calculation which is extremely common.

The chart only shows the rows of the selected two dates. To show more rows would be perceived as a bug.
The same logic is of course used if you show just the expression with the total:

Bottom line: An expression using the "Total" qualifier will not be used to determine which rows to show in a chart.
Should you want to force QlikView to show more rows, you can add a second expression or add a zero-valued term in the same expression:

HIC
- Mark as New
- Bookmark
- Subscribe
- Mute
- Subscribe to RSS Feed
- Permalink
- Report Inappropriate Content
Hi,
i think this is a bug but this is only related to the chart. Just add another expression sum({1} Data) and you see all.
You can enable in the chart also "show all values" and "supress null ..." and than you will get also all entries.

bye
Konrad
- Mark as New
- Bookmark
- Subscribe
- Mute
- Subscribe to RSS Feed
- Permalink
- Report Inappropriate Content
Hi,
I have checked this also in sense, same behauvior.
bye
Konrad
- Mark as New
- Bookmark
- Subscribe
- Mute
- Subscribe to RSS Feed
- Permalink
- Report Inappropriate Content
I can reproduce this on QV 11 SR11 x64.
Not sure if this is a symptom of a bug or by design (and if it's by design, if you want to call it a defect).
I assume it's by the nature of the TOTAL qualifier that the expression is not evaluated per dimension line, and thus the limitation of the dimension values is given by the field selection, not by the set expression.
- Mark as New
- Bookmark
- Subscribe
- Mute
- Subscribe to RSS Feed
- Permalink
- Report Inappropriate Content
Yes, that is where a confirmation is required. Is it by-design or a bug? May be hic can help.
- Mark as New
- Bookmark
- Subscribe
- Mute
- Subscribe to RSS Feed
- Permalink
- Report Inappropriate Content
Hi. " Sum({1} Total Data) should not get affected by any selection" - it is not fully correct explanation. It means that from field "Data" is ised all values for calculating and set of values does not depends from selections. That is all. .
When you use expression "Sum({1} Total Data)" you obtain always only one value and chart shows it one. Selection in field "Data" not affects to result of expression "Sum({1} Total Data)", but affects to set for representation.
When you use expression "Sum(Total Data)" you obtain set of values, which depends from selections and chart chows it as several values.
Visualisation depends from settings in chart. For instance, in your application you can show all values of dimension if set parameter dimension "show all values" in true
- Mark as New
- Bookmark
- Subscribe
- Mute
- Subscribe to RSS Feed
- Permalink
- Report Inappropriate Content
Hi,
Same for me also, as per QV help file even you select the value it should not reflect in the chart.
This is from Qlikview help file
sum( {1} Total Sales )
returns total sales within the application, disregarding both selection and dimension. I.e. the same as sum(All Sales). --- This is misleading
I am using QV11.2 SR9
I think it is a bug.
Regards,
jagan.
- Mark as New
- Bookmark
- Subscribe
- Mute
- Subscribe to RSS Feed
- Permalink
- Report Inappropriate Content
No, it's not a bug. It is expected behaviour, and in my mind the best solution.
The reason is that the "Total" qualifier makes the engine treat the aggregation like a constant in the hypercube. It does not make sense to create an entire cube (all combinations of all dimensions) and then fill it with the same number. Hence, an expression with "Total" is not used to determine which rows to show in the chart. Further, when you use the "Total" qualifier, you indeed use it like a constant.
The best way to explain this is probably by an example. In the picture below, I use the "Total" qualifier to calculate a percentage (see column header to the right) - a type of calculation which is extremely common.

The chart only shows the rows of the selected two dates. To show more rows would be perceived as a bug.
The same logic is of course used if you show just the expression with the total:

Bottom line: An expression using the "Total" qualifier will not be used to determine which rows to show in a chart.
Should you want to force QlikView to show more rows, you can add a second expression or add a zero-valued term in the same expression:

HIC
- Mark as New
- Bookmark
- Subscribe
- Mute
- Subscribe to RSS Feed
- Permalink
- Report Inappropriate Content
Henric,
I was thinking the same thing but I had no idea about the zero expression, I'm bookmarking that one as an important tip.
Thanks
Chris