Unlock a world of possibilities! Login now and discover the exclusive benefits awaiting you.
- Qlik Community
- :
- All Forums
- :
- QlikView App Dev
- :
- Re: Text on Axis and Value on Data Points Colors
- Subscribe to RSS Feed
- Mark Topic as New
- Mark Topic as Read
- Float this Topic for Current User
- Bookmark
- Subscribe
- Mute
- Printer Friendly Page
- Mark as New
- Bookmark
- Subscribe
- Mute
- Subscribe to RSS Feed
- Permalink
- Report Inappropriate Content
Text on Axis and Value on Data Points Colors
I have a chart with two expressions: The count of items and the percentage of that count of items. I am trying to make the text on axis BLACK and the text on data points WHITE. It seems like I cannot change the color of each expression seperately. The only changes that are applied are the changes I make in the Count expression. I have tried changing the Text Color in the Percent expression and it does nothing. I included a screenshot below to clarify.
Any help is appreciated. Thank you.
Accepted Solutions
- Mark as New
- Bookmark
- Subscribe
- Mute
- Subscribe to RSS Feed
- Permalink
- Report Inappropriate Content
- Mark as New
- Bookmark
- Subscribe
- Mute
- Subscribe to RSS Feed
- Permalink
- Report Inappropriate Content
Hi David
Can you please share your qvw file? Have you used the colormix?
Regards,
MB
- Mark as New
- Bookmark
- Subscribe
- Mute
- Subscribe to RSS Feed
- Permalink
- Report Inappropriate Content
Hi David,
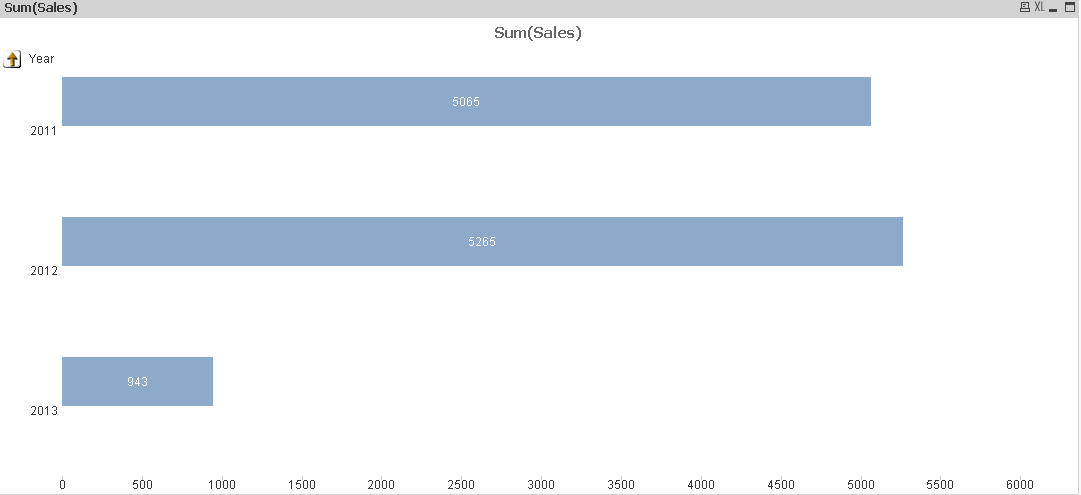
Do you need change the colors like this example?
Regards.
- Mark as New
- Bookmark
- Subscribe
- Mute
- Subscribe to RSS Feed
- Permalink
- Report Inappropriate Content
You can use DUAL to add an overlay to the bar, which can be a different colour.
- Mark as New
- Bookmark
- Subscribe
- Mute
- Subscribe to RSS Feed
- Permalink
- Report Inappropriate Content
Like this?

Regards,
MB
- Mark as New
- Bookmark
- Subscribe
- Mute
- Subscribe to RSS Feed
- Permalink
- Report Inappropriate Content
Miguel - I cannot share my qvw and I do not think I need the color mix option. The way I understand the color mix is that it changes color based on expression value. I am simply trying to make the text of different expressions different colors to differentiate on the same graph.
- Mark as New
- Bookmark
- Subscribe
- Mute
- Subscribe to RSS Feed
- Permalink
- Report Inappropriate Content
Thanks for this Tiago. I had to switch around some things on my chart to match what you had in your example and it worked.
- Mark as New
- Bookmark
- Subscribe
- Mute
- Subscribe to RSS Feed
- Permalink
- Report Inappropriate Content
hi James, could you tell how i can make use of dual to achieve the graph you post?