Unlock a world of possibilities! Login now and discover the exclusive benefits awaiting you.
- Qlik Community
- :
- All Forums
- :
- QlikView App Dev
- :
- Thousand/Million/Billion Symbol calculation / Wron...
- Subscribe to RSS Feed
- Mark Topic as New
- Mark Topic as Read
- Float this Topic for Current User
- Bookmark
- Subscribe
- Mute
- Printer Friendly Page
- Mark as New
- Bookmark
- Subscribe
- Mute
- Subscribe to RSS Feed
- Permalink
- Report Inappropriate Content
Thousand/Million/Billion Symbol calculation / Wrong rendering
Hi,
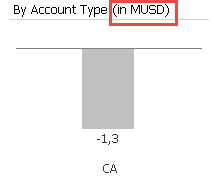
I had my issues to find the right title for my challenge. To save space on my dashboard, I moved the "symbol" out of the chart into the caption.

The corresponding formula is fairly straight forward:
='By Account Type (in '&
If(Max(Fabs(Aggr(SUM({$<$(vSetEstimate) $(eSetYTD)>} $(vMeasure)) - SUM({$<$(vSetCompareTo) $(eSetYTD)>} $(vMeasure)), [Account Type]))) < 1000, $(eMeasureLabel),
If(Max(Fabs(Aggr(SUM({$<$(vSetEstimate) $(eSetYTD)>} $(vMeasure)) - SUM({$<$(vSetCompareTo) $(eSetYTD)>} $(vMeasure)), [Account Type]))) < 1000000, 'k'&$(eMeasureLabel),
'M'&$(eMeasureLabel)))
&')'
To ensure the use of the right scale, I followed Rob Wunderlichs (@QVCookbook) advise and used the following formula in "Static Step" in the Axes tab of the chart.
=If(Max(Fabs(Aggr(SUM({$<$(vSetEstimate), [Group]-={'UNMATCHED'} $(eSetYTD)>} $(vMeasure)) - SUM({$<$(vSetCompareTo), [Group]-={'UNMATCHED'} $(eSetYTD)>} $(vMeasure)), [Group]))) < 1000, 1,
If(Max(Fabs(Aggr(SUM({$<$(vSetEstimate), [Group]-={'UNMATCHED'} $(eSetYTD)>} $(vMeasure)) - SUM({$<$(vSetCompareTo), [Group]-={'UNMATCHED'} $(eSetYTD)>} $(vMeasure)), [Group]))) < 1000000, 1000,
1000000))
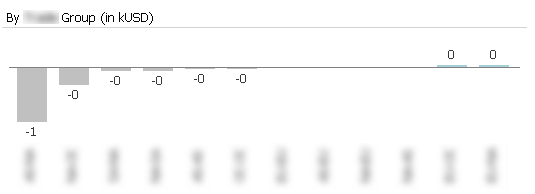
The problem is, that the hardcoded values <1000, <100 000 and <1 000 000 don't really seem to make sense as you can see when looking at the outcome.

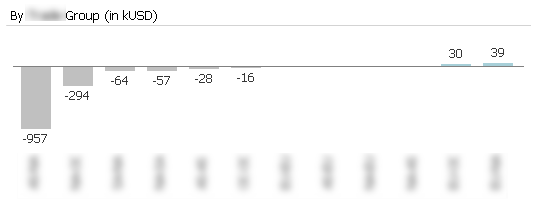
The formula for determining "in kUSD" is build up on the same principle as you saw on top for account type just with a different dimension for the Aggr function. The actual value for the first bar is -956 000 USD. Even when I set the "Static Step" manually to 1000, it doesn't switch.
While writing this post, I just remembered another post (think on Robs blog) about the unexpected behaviour of the chart, when there is not enough space (for whatever). So I just increased the chart in size, and voila, the chart renders correctly.

Anyone an idea how to force the chart to always render correctly?