Unlock a world of possibilities! Login now and discover the exclusive benefits awaiting you.
- Qlik Community
- :
- All Forums
- :
- QlikView App Dev
- :
- Re: Tiers of Premium Show incorrect
- Subscribe to RSS Feed
- Mark Topic as New
- Mark Topic as Read
- Float this Topic for Current User
- Bookmark
- Subscribe
- Mute
- Printer Friendly Page
- Mark as New
- Bookmark
- Subscribe
- Mute
- Subscribe to RSS Feed
- Permalink
- Report Inappropriate Content
Tiers of Premium Show incorrect
Hello Community,
I am stuck in a problem related to Ranges of Premium.
This project is related to Insurance Company
we have Client Code , Policy , Premium of Policy and Tiers
I have 3 tiers which are as follows
TIER
| 200000-499999 |
| 500000-999999 |
| 1000000 & above |
I have Client Code 12345 for example
12345 holds 4 policies
123456
678944
123456
i want to show the Sum of Premium for above 4 policies which is belong to Clinet Code 12345.
For example if the Sum of these Policies is 800000, then this Client Should Fall on 2nd Tier i.e. 500000-999999 and the Count of Policies shows 4 and Client Code Count is 1.
I am unable to implement this on pivot chart please help me out to rectify the issue.
for more Clarity PLease refer the attached snap shot for your reference.
Regards
Noman Khan
- Mark as New
- Bookmark
- Subscribe
- Mute
- Subscribe to RSS Feed
- Permalink
- Report Inappropriate Content
Any one please???
- Mark as New
- Bookmark
- Subscribe
- Mute
- Subscribe to RSS Feed
- Permalink
- Report Inappropriate Content
Perhaps this?
If(Sum(POLICY) >= 200000 and Sum(POLICY) <= 499999, '200000 - 499999',
If(Sum(POLICY) >= 500000 and Sum(POLICY) <= 999999, '500000 - 999999',
'1000000 & above')) as TIER
Pick(Match([Client Code], 1234567, 123456, 678944, 1234561), 12345) as [Client Code]
Now, you can use TIER as Dimension and check
- Mark as New
- Bookmark
- Subscribe
- Mute
- Subscribe to RSS Feed
- Permalink
- Report Inappropriate Content
I dont want to make hard code client code as its came from system.
we have a lot of clients at this moment, i just paste an example for the reference.
Tier already made through QlikView Script.
- Mark as New
- Bookmark
- Subscribe
- Mute
- Subscribe to RSS Feed
- Permalink
- Report Inappropriate Content
What is the logic behind to pick Client code and Which are they?
- Mark as New
- Bookmark
- Subscribe
- Mute
- Subscribe to RSS Feed
- Permalink
- Report Inappropriate Content
can i sent u the file in personal?
- Mark as New
- Bookmark
- Subscribe
- Mute
- Subscribe to RSS Feed
- Permalink
- Report Inappropriate Content
Hi Noman
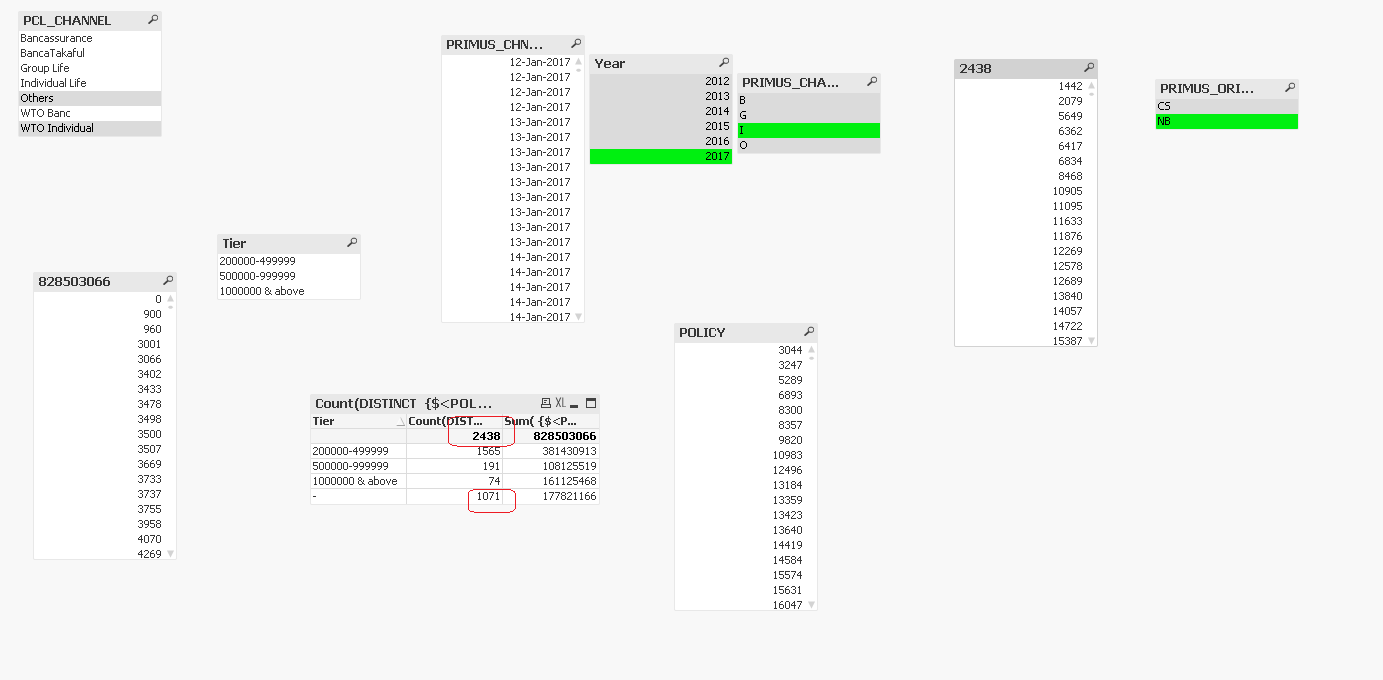
it looks like there are some ploicy which falls under <200000 which you don't have any category defined. so the value are coming as null in table and has a count of 1071 and when corresponding value for that null is getting selected the tier filter has no associated vale so gray.
if your script is properly written for tier
you can use a table with tier,Client code as dimension count of (policy_field ),sum(your measure_field ) as your two expression.
regards
Pradosh
- Mark as New
- Bookmark
- Subscribe
- Mute
- Subscribe to RSS Feed
- Permalink
- Report Inappropriate Content
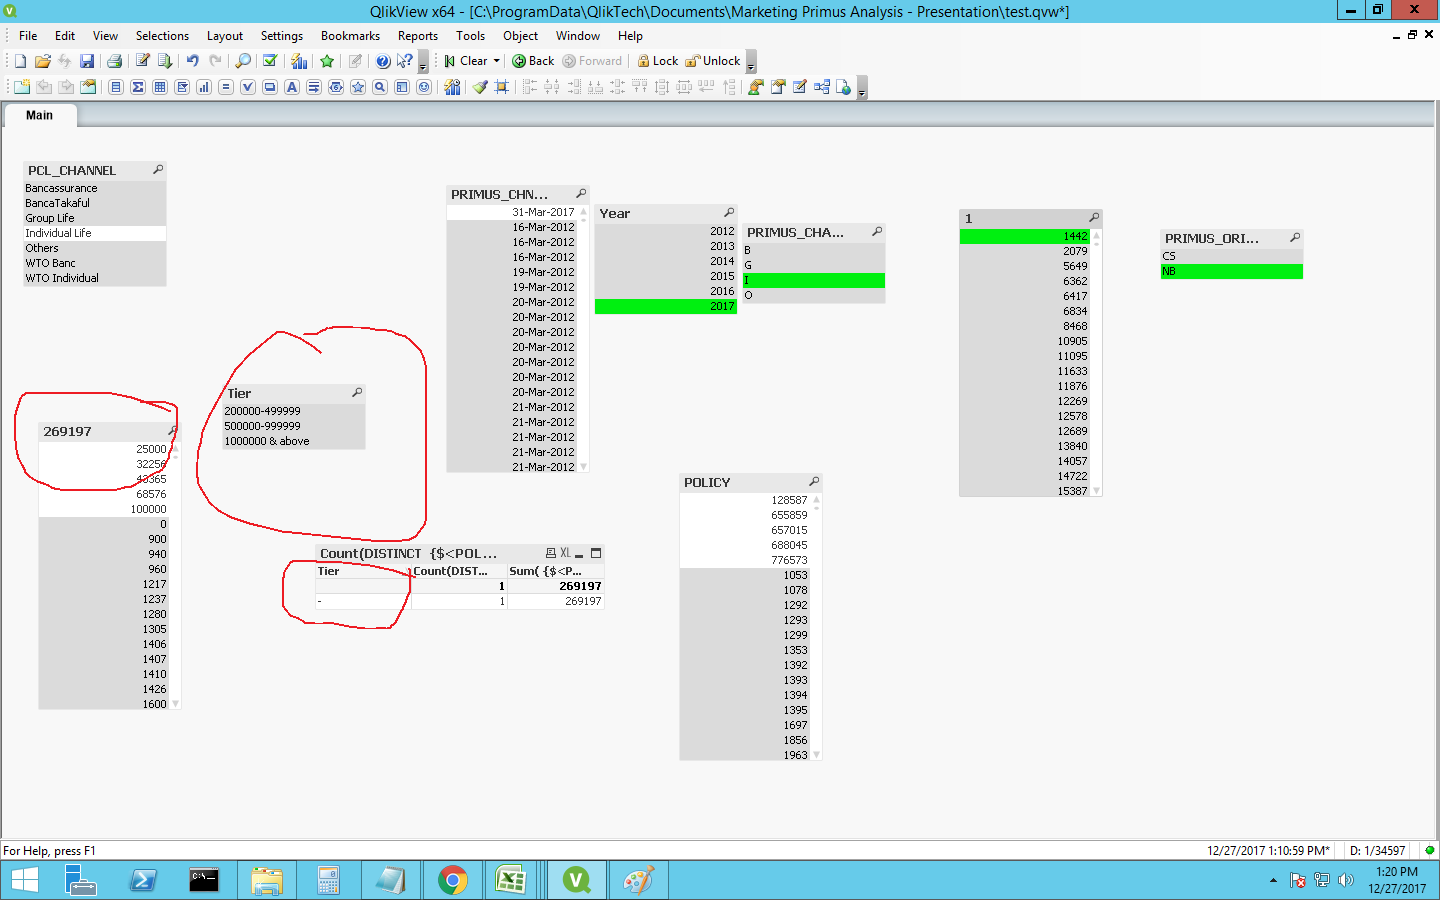
May be this helps Scrambling Data