Unlock a world of possibilities! Login now and discover the exclusive benefits awaiting you.
- Qlik Community
- :
- All Forums
- :
- QlikView App Dev
- :
- Trending with Line Chart
- Subscribe to RSS Feed
- Mark Topic as New
- Mark Topic as Read
- Float this Topic for Current User
- Bookmark
- Subscribe
- Mute
- Printer Friendly Page
- Mark as New
- Bookmark
- Subscribe
- Mute
- Subscribe to RSS Feed
- Permalink
- Report Inappropriate Content
Trending with Line Chart
I am trying to trend a growth rate fact with a time dimension, MonthYear. The growth rate is calculated as:
[current month prescriptions]/[previous month prescription] - 1 and formatted as a percentage. To test the calculation, i have created a text object which yields the following value:

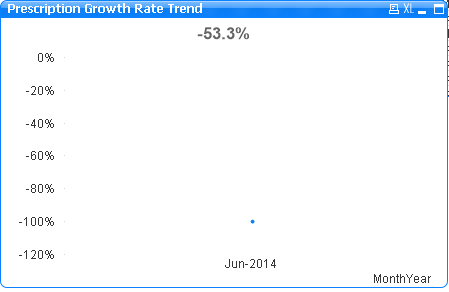
However when i try to trend the growth rate in a line chart over the MonthYear dimension, only one point is displayed as follows:

The value displayed is for only one point which is the last MonthYear equivalent. Can you assist in resolving this problem.
Regards
Chris
- Tags:
- qlikview
Accepted Solutions
- Mark as New
- Bookmark
- Subscribe
- Mute
- Subscribe to RSS Feed
- Permalink
- Report Inappropriate Content
Managed to figure is out with the following expression for the growth rate:
=count(DISTINCT [Script Number])/Above(Count(DISTINCT [Script Number]))-1
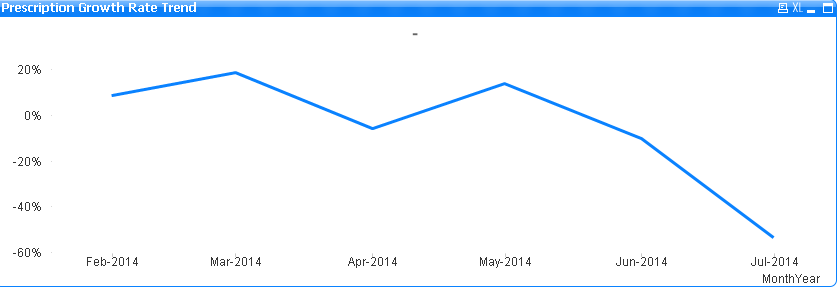
with the following result:

Thank you all
Regards.
Chris
- Mark as New
- Bookmark
- Subscribe
- Mute
- Subscribe to RSS Feed
- Permalink
- Report Inappropriate Content
Hi,
Could you please post an example QlikView file?
thanks,
Rajesh Vaswani
- Mark as New
- Bookmark
- Subscribe
- Mute
- Subscribe to RSS Feed
- Permalink
- Report Inappropriate Content
Many thanks Rajesh
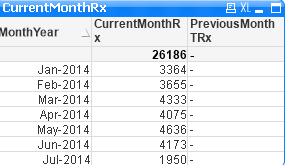
I have seen where the problem is. My expression for calculating 'Previous Month' has errors. I tested it out by constructing the following straight table:

The expression for 'Current Month' is:
=Count(Distinct [Script Number])
I tried the following for previous month which is yielding the above result:
=Count(${<Month = $(=max(Month)-1)>}Distinct[Script Number])
Can you assist?
Regards
Chris
- Mark as New
- Bookmark
- Subscribe
- Mute
- Subscribe to RSS Feed
- Permalink
- Report Inappropriate Content
Use this :
=sum(prescriptions)/above(sum(prescriptions))-1 in the chart and you will get what you need. And of course check the percentage box
Cheers ![]()
- Mark as New
- Bookmark
- Subscribe
- Mute
- Subscribe to RSS Feed
- Permalink
- Report Inappropriate Content
Managed to figure is out with the following expression for the growth rate:
=count(DISTINCT [Script Number])/Above(Count(DISTINCT [Script Number]))-1
with the following result:

Thank you all
Regards.
Chris
- Mark as New
- Bookmark
- Subscribe
- Mute
- Subscribe to RSS Feed
- Permalink
- Report Inappropriate Content
Many thanks Utkarsh, that is the right approach, i had managed to figure it out when i got your response.
Most appreciated
- Mark as New
- Bookmark
- Subscribe
- Mute
- Subscribe to RSS Feed
- Permalink
- Report Inappropriate Content
Happy to write a helpful answer.
Cheers ![]()