Unlock a world of possibilities! Login now and discover the exclusive benefits awaiting you.
- Qlik Community
- :
- All Forums
- :
- QlikView App Dev
- :
- Trouble with understanding and showing data
- Subscribe to RSS Feed
- Mark Topic as New
- Mark Topic as Read
- Float this Topic for Current User
- Bookmark
- Subscribe
- Mute
- Printer Friendly Page
- Mark as New
- Bookmark
- Subscribe
- Mute
- Subscribe to RSS Feed
- Permalink
- Report Inappropriate Content
Trouble with understanding and showing data
Hi.
I have a big trouble here ![]() I would really appricate all inputs you could have because i have been sitting with this trouble for a while now...
I would really appricate all inputs you could have because i have been sitting with this trouble for a while now...
Lets go.
I have a connection to a ODBC and import some data.
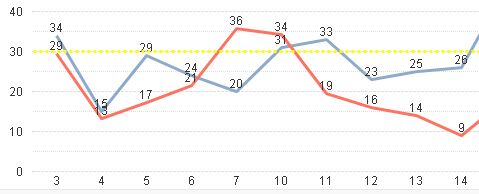
I have made a chart showing Number of Calls and the Average quetime via Sum(aband_call)+Sum(answ_call) and Sum(queued_and_answ)/Sum(answ_call).
Please see the results below.

So, the 3:th there was 34 Calls in total and the average queue time was 29 seconds.
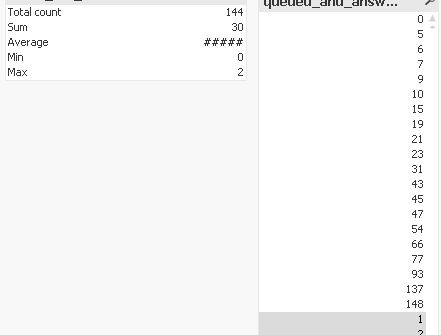
If i only look at the Sum(answ_call) i can see that there was 30 calls this day and i can also see in the Queued_and_answ listbox that there is some values showing the duration of the calls.

I can see that if i choose all these number in the Queued_and_answ i get the Sum of 30 calls.
Sorry for the long introduction ![]()
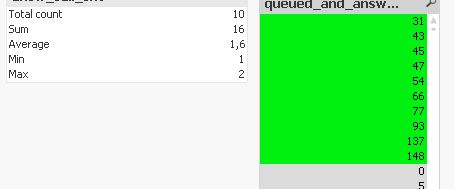
Now i want to see how many calls that were over 30 seconds long. In my mind i just need to select from 31 to 148 and the Sum shouls be right.
The right number should be 12. But i dont get that.. I get 16..

I can't understand this, so any input would really be appreciated!!
Thanks
//Erik
- Tags:
- new_to_qlikview
- Mark as New
- Bookmark
- Subscribe
- Mute
- Subscribe to RSS Feed
- Permalink
- Report Inappropriate Content
Erik
Can you upload a sample of your qvw file. That will help diagnose the problem.
Jonathan
- Mark as New
- Bookmark
- Subscribe
- Mute
- Subscribe to RSS Feed
- Permalink
- Report Inappropriate Content
Im connected to a ODBC SQL server, so i think it will be hard for you to see the data 😕
- Mark as New
- Bookmark
- Subscribe
- Mute
- Subscribe to RSS Feed
- Permalink
- Report Inappropriate Content
Erik
The qvw only connects to ODBC during reload, so you can upload the qvw file for someone to suggest how to solve your problem.
Jonathan
- Mark as New
- Bookmark
- Subscribe
- Mute
- Subscribe to RSS Feed
- Permalink
- Report Inappropriate Content
Ok! But i only use Private License, will you still be able to open?
- Mark as New
- Bookmark
- Subscribe
- Mute
- Subscribe to RSS Feed
- Permalink
- Report Inappropriate Content
Hi Erik,
Qlikview will reduce all lines that have the same value. So if you have 2 calls that both take 31 seconds, it will show only once 31 in the listbox. In the count however, it will count 2x (as you had 2 calls). Could your issue be just this trick Qlikview is playing with you?
- Mark as New
- Bookmark
- Subscribe
- Mute
- Subscribe to RSS Feed
- Permalink
- Report Inappropriate Content
Thx for you answer.
When i do a SUM over all values in Queued_and_answ divided by the number of calls i get the right value.
So i have noticed that if i have 2 calls that are 31 seconds. But the Sum does count that.
I want to see how many calls that are over 30 seconds.
And i know that the max value in Queued_and_answ are right. And i know as i said in the first sentence here, that the average queuetime is right.
- Mark as New
- Bookmark
- Subscribe
- Mute
- Subscribe to RSS Feed
- Permalink
- Report Inappropriate Content
Hi,
In your Queued_and_answ list box see the frequency which shows you that the same number call how many times..
you can do this by go to property window->General->show frequency..
Please appreciate our Qlik community members by giving Kudos for sharing their time for your query. If your query is answered, please mark the topic as resolved 🙂
- Mark as New
- Bookmark
- Subscribe
- Mute
- Subscribe to RSS Feed
- Permalink
- Report Inappropriate Content
Yes, this helps me to show the Total Count.
But still the total SUM is right. But when i choose all values over 30 i get the wrong Sum