Unlock a world of possibilities! Login now and discover the exclusive benefits awaiting you.
- Qlik Community
- :
- All Forums
- :
- QlikView App Dev
- :
- Unique employees per year next to multiple dimensi...
- Subscribe to RSS Feed
- Mark Topic as New
- Mark Topic as Read
- Float this Topic for Current User
- Bookmark
- Subscribe
- Mute
- Printer Friendly Page
- Mark as New
- Bookmark
- Subscribe
- Mute
- Subscribe to RSS Feed
- Permalink
- Report Inappropriate Content
Unique employees per year next to multiple dimensions
Hi,
At the moment I am working on a graph that shows the percentage of employees that leave our company per age group.
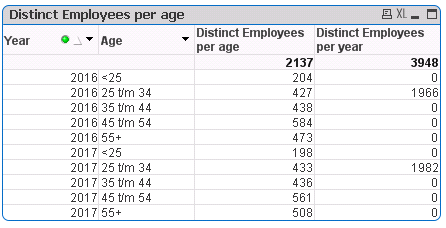
When I calculate the number of unique employees per year to show the percentage only one age group appears in the graph.
I made a table to see what happens. When I use the expression count({<EmployeeNumber= {"*"}-{0}, AgeGroup=,WorkingYears=>} DISTINCT EmployeeNumber) only one age group has the number of unique employees.
Which expression do I need to use to see the number of unique employees at every age group?
Thanks in advance!
Jan Willem Tiemessen

Accepted Solutions
- Mark as New
- Bookmark
- Subscribe
- Mute
- Subscribe to RSS Feed
- Permalink
- Report Inappropriate Content
If you are using Aggr() function then use NODISTINCT with it.
like Aggr(NODISTINCT Count(Distinct EmployeeNumber), Year).
You can add your set expression to it as needed.
- Mark as New
- Bookmark
- Subscribe
- Mute
- Subscribe to RSS Feed
- Permalink
- Report Inappropriate Content
Are you using an Aggr() function somewhere
- Mark as New
- Bookmark
- Subscribe
- Mute
- Subscribe to RSS Feed
- Permalink
- Report Inappropriate Content
If you are using Aggr() function then use NODISTINCT with it.
like Aggr(NODISTINCT Count(Distinct EmployeeNumber), Year).
You can add your set expression to it as needed.
- Mark as New
- Bookmark
- Subscribe
- Mute
- Subscribe to RSS Feed
- Permalink
- Report Inappropriate Content
NODISTINCT is the solution! Thanks!