Unlock a world of possibilities! Login now and discover the exclusive benefits awaiting you.
- Qlik Community
- :
- All Forums
- :
- QlikView App Dev
- :
- Urgent - Progress line showing Max and Average dat...
- Subscribe to RSS Feed
- Mark Topic as New
- Mark Topic as Read
- Float this Topic for Current User
- Bookmark
- Subscribe
- Mute
- Printer Friendly Page
- Mark as New
- Bookmark
- Subscribe
- Mute
- Subscribe to RSS Feed
- Permalink
- Report Inappropriate Content
Urgent - Progress line showing Max and Average date deviation
Hello Team,
I have the following columns already loaded in qvw. I want to create a Progress chart (over the time period) to show the progress.
Table: (sample data)
ProjectName RequirementExpectedDate RequirementActualDate ProjectGoLiveDate
xxx 1/1/2016 1/15/2016 2/15/2016
yyy 2/10/2015 2/10/2015 2/1/2015
zzz 11/11/2015 11/12/2015 11/20/2015
xxx1 1/1/2016 1/15/2016 2/15/2016
yyy1 2/10/2015 2/10/2015 2/1/2015
zzz1 11/11/2015 11/12/2015 11/20/2015
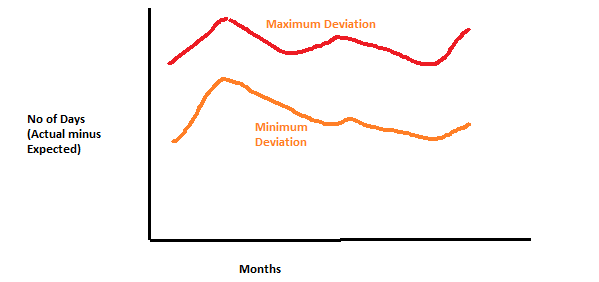
Now my requirement is to show how the Maximum,Minimum and Average difference of RequirementExpectedDate and RequirementActualDate has progressed over the period (ProjectGoLiveDate).
X-Axis should show the date difference (in days) - (better if we can use the Networkingdays function to exclude weekends)
Y -Axis should show the GoLiveMonths (Month of ProjectGoLiveDate field)
Sample Graph what I am looking for:

Can you all please guide me.
Thanks
- Tags:
- new_to_qlikview
- Mark as New
- Bookmark
- Subscribe
- Mute
- Subscribe to RSS Feed
- Permalink
- Report Inappropriate Content
max(networkdays(RequirementExpectedDate,RequirementActualDate))
min(networkdays(RequirementExpectedDate,RequirementActualDate))
avg(networkdays(RequirementExpectedDate,RequirementActualDate))
talk is cheap, supply exceeds demand