Unlock a world of possibilities! Login now and discover the exclusive benefits awaiting you.
- Qlik Community
- :
- All Forums
- :
- QlikView App Dev
- :
- Re: Values on Data points not pulling properly!
- Subscribe to RSS Feed
- Mark Topic as New
- Mark Topic as Read
- Float this Topic for Current User
- Bookmark
- Subscribe
- Mute
- Printer Friendly Page
- Mark as New
- Bookmark
- Subscribe
- Mute
- Subscribe to RSS Feed
- Permalink
- Report Inappropriate Content
Values on Data points not pulling properly!
Hi,
I have got a chart and I have 4 expressions and need to display the numbers on the chart like in the pic attached.
I have used 'Values on data points for all the expresisons but in the chart some of the figures are missing.
How can i get all the figures on the bar chart.
Any help is appreciated.
Regards,
Vamsi.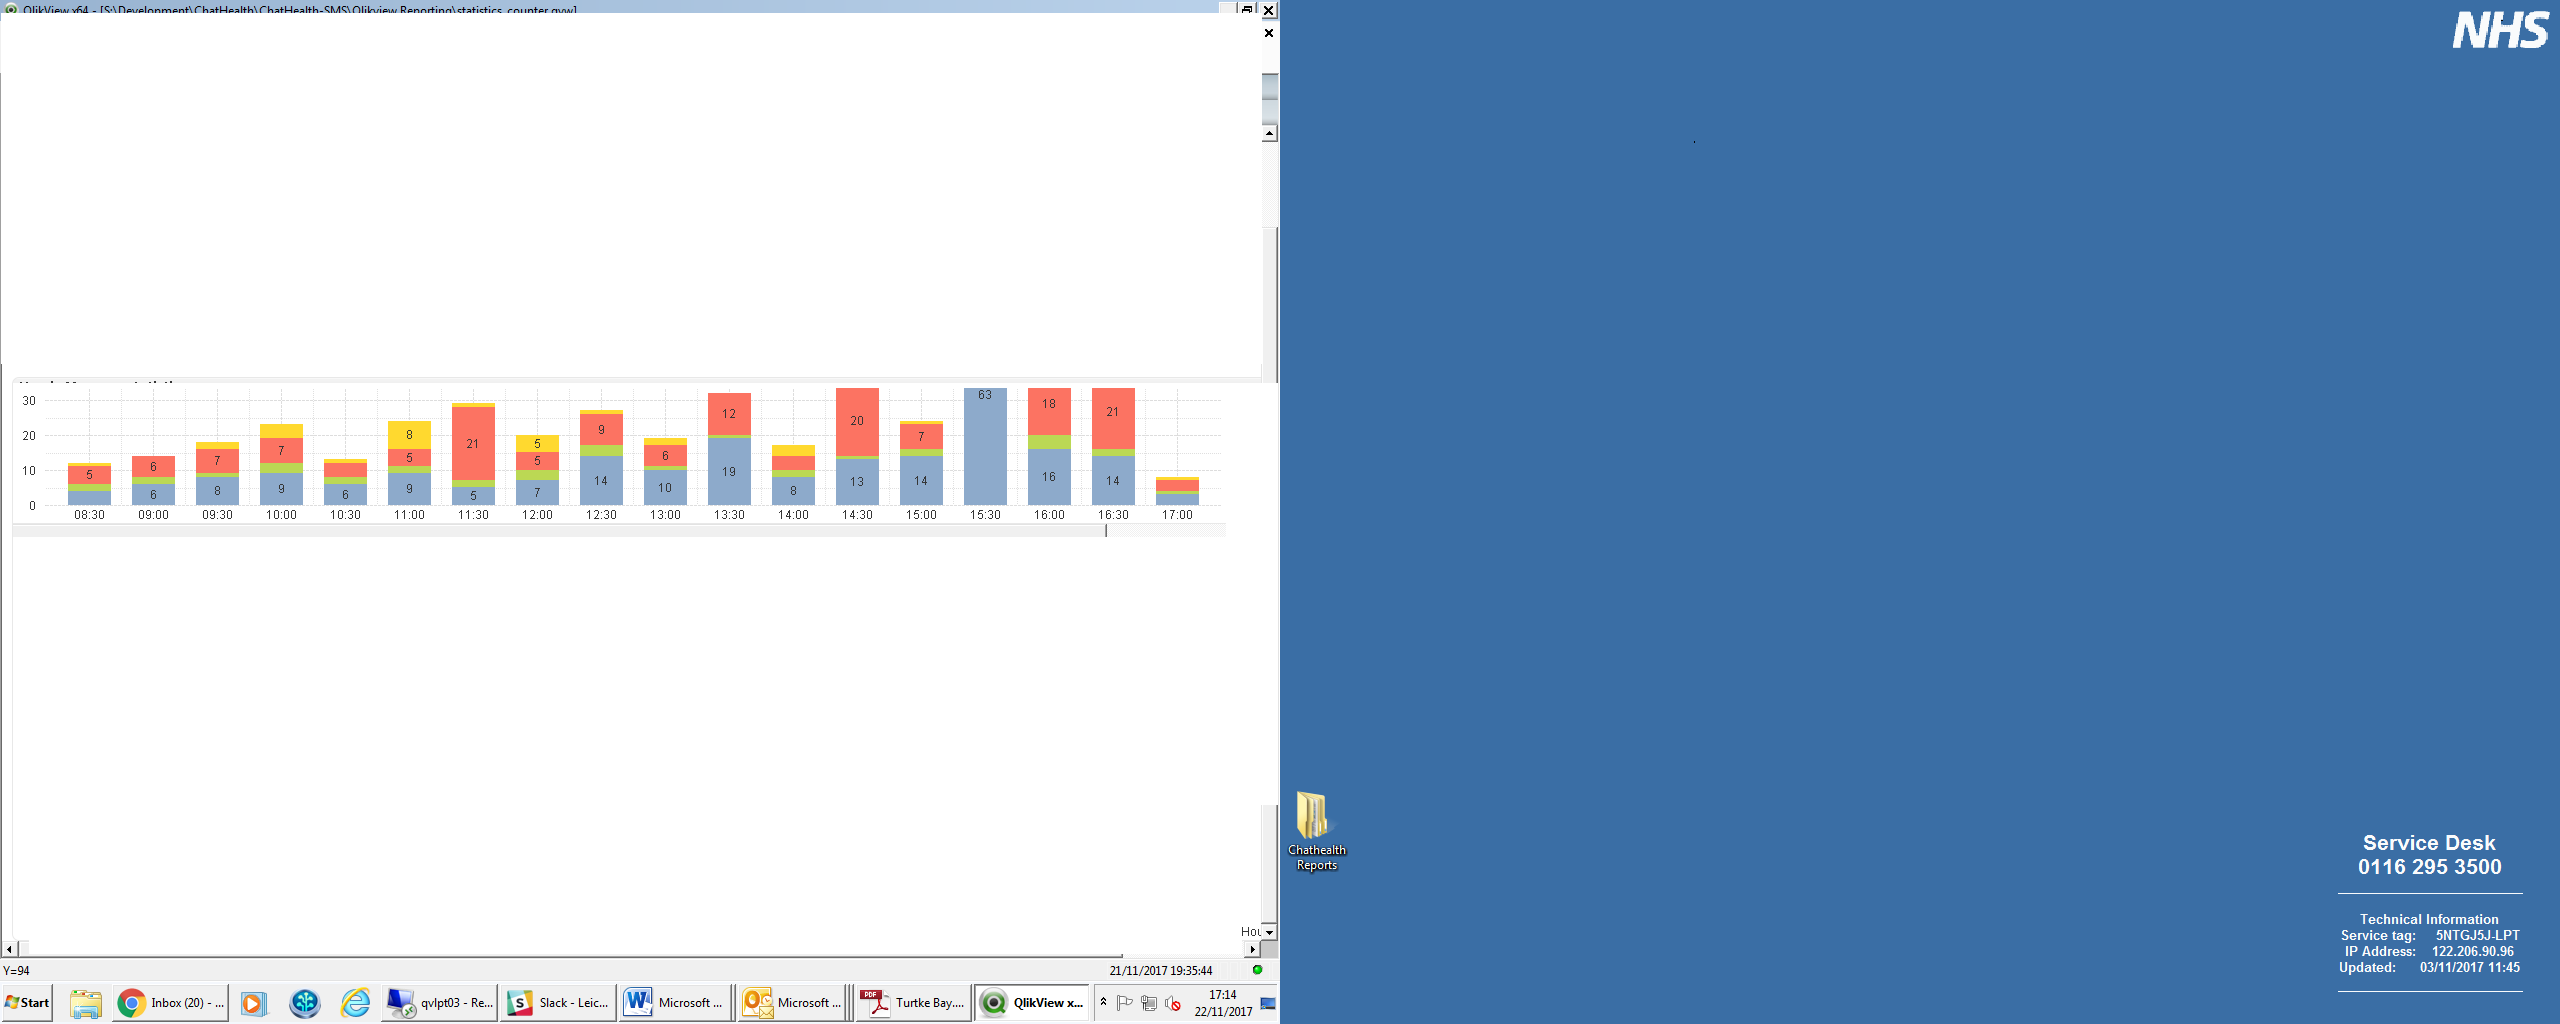
- Mark as New
- Bookmark
- Subscribe
- Mute
- Subscribe to RSS Feed
- Permalink
- Report Inappropriate Content
It will be helpful if you can attach a small sample. Also try resizing the chart and see if that helps..
- Mark as New
- Bookmark
- Subscribe
- Mute
- Subscribe to RSS Feed
- Permalink
- Report Inappropriate Content
Hi Vamsi,
Can you try to give the Static Step with small numbers in the 'Axes' Tab?
If the bar size is small , the value won't display inside.
- Mark as New
- Bookmark
- Subscribe
- Mute
- Subscribe to RSS Feed
- Permalink
- Report Inappropriate Content
Hi,
Yes i tried static step but no use.
I still dont see some of the values.
- Mark as New
- Bookmark
- Subscribe
- Mute
- Subscribe to RSS Feed
- Permalink
- Report Inappropriate Content
In the picture attached, only values that fit inside their segment are displayed. If that's what you want, that's what QlikView already does.
If you expect values to be plotted inside of segments when they don't fit - unfortunately, as far as I know that's simply not possible. You could downsize the chart's font until values fit inside most of the segments, or increase the chart height (or modify its Y axis) until the segments are big enough to fit numbers.
- Mark as New
- Bookmark
- Subscribe
- Mute
- Subscribe to RSS Feed
- Permalink
- Report Inappropriate Content
Ok thanks for the reply.
Can you tell me how to set the font size of the chart.
cant find in the properties.
Any clue?
- Mark as New
- Bookmark
- Subscribe
- Mute
- Subscribe to RSS Feed
- Permalink
- Report Inappropriate Content
It has its own tab, called "Font".