Unlock a world of possibilities! Login now and discover the exclusive benefits awaiting you.
- Qlik Community
- :
- All Forums
- :
- QlikView App Dev
- :
- Values on data points not displaying on stacked ba...
- Subscribe to RSS Feed
- Mark Topic as New
- Mark Topic as Read
- Float this Topic for Current User
- Bookmark
- Subscribe
- Mute
- Printer Friendly Page
- Mark as New
- Bookmark
- Subscribe
- Mute
- Subscribe to RSS Feed
- Permalink
- Report Inappropriate Content
Values on data points not displaying on stacked bar
Hi Everyone
This may be a bug I don't know but thought I'd post here in case someone had the answer. I have a stacked bar chart with 3 expressions and I want to display the total values using the "Values on Data Points" check box. This sounds easy and it works fine if I am only using two expressions but the minute I add the third the data values on the bar charts disappear completely! (by this I mean the values not the bars)
**EDIT: I actually have two other expressions which are displayed as lines on the chart as well (It's a Combo chart) - removing one of these lines makes it magically re-appear!
So far I have tried:
First thing I did was update the client to 11.2 SR9 in case of a bug.
I tried removing the expressions and adding them in again 1 by 1. As soon as I got to the third expression the values disappeared.
I tried different combinations of checking and un-checking in a different order - nothing.
Can anybody offer any advice?
Thanks
Stu
Accepted Solutions
- Mark as New
- Bookmark
- Subscribe
- Mute
- Subscribe to RSS Feed
- Permalink
- Report Inappropriate Content
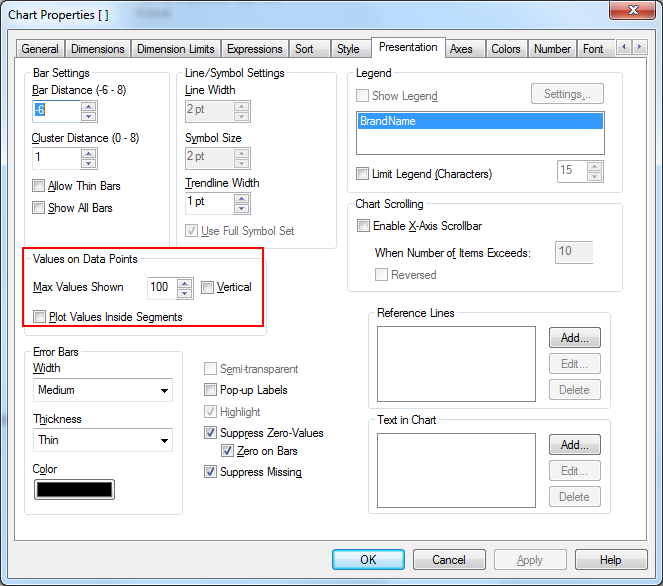
I think you can try to set the max values on data point in the presentation tab to a higher value

- Mark as New
- Bookmark
- Subscribe
- Mute
- Subscribe to RSS Feed
- Permalink
- Report Inappropriate Content
I think you can try to set the max values on data point in the presentation tab to a higher value

- Mark as New
- Bookmark
- Subscribe
- Mute
- Subscribe to RSS Feed
- Permalink
- Report Inappropriate Content
Thank you Piet!
I'm not 100% sure what that actually does but I changed the value to 200 and it now works!
Thanks again for the speedy response and have a good day.
- Mark as New
- Bookmark
- Subscribe
- Mute
- Subscribe to RSS Feed
- Permalink
- Report Inappropriate Content
You're welcome. I think it was ment to prevent a clutter of values being displayed in a chart