Unlock a world of possibilities! Login now and discover the exclusive benefits awaiting you.
- Qlik Community
- :
- All Forums
- :
- QlikView App Dev
- :
- Want to Show Sub Total in QlikView Report
- Subscribe to RSS Feed
- Mark Topic as New
- Mark Topic as Read
- Float this Topic for Current User
- Bookmark
- Subscribe
- Mute
- Printer Friendly Page
- Mark as New
- Bookmark
- Subscribe
- Mute
- Subscribe to RSS Feed
- Permalink
- Report Inappropriate Content
Want to Show Sub Total in QlikView Report
Hello Experts,
I just want to show subtotal in my QlikView report ie.
That is my Orignal Data:
Year | Month | Quarter | Name | Sales |
| 2001 | January | Q1 | Tata | 1000 |
| 2001 | February | Q1 | Tata | 1000 |
| 2001 | March | Q1 | Tata | 2000 |
| 2001 | April | Q2 | Tata | 2000 |
| 2001 | May | Q2 | Tata | 1000 |
| 2001 | June | Q2 | Tata | 1000 |
| 2001 | July | Q3 | Tata | 1000 |
| 2001 | August | Q3 | Tata | 1000 |
| 2001 | September | Q3 | Tata | 2000 |
| 2001 | October | Q4 | Tata | 2000 |
| 2001 | November | Q4 | Tata | 2000 |
| 2001 | December | Q4 | Tata | 4000 |
| 2001 | January | Q1 | Barclay | 100000 |
| 2001 | February | Q1 | Barclay | 50000 |
| 2001 | March | Q1 | Barclay | 50000 |
| 2001 | April | Q2 | Barclay | 200000 |
| 2001 | May | Q2 | Barclay | 100000 |
| 2001 | June | Q2 | Barclay | 100000 |
| 2001 | July | Q3 | Barclay | 50000 |
| 2001 | August | Q3 | Barclay | 50000 |
| 2001 | September | Q3 | Barclay | 100000 |
| 2001 | October | Q4 | Barclay | 50000 |
| 2001 | November | Q4 | Barclay | 100000 |
| 2001 | December | Q4 | Barclay | 50000 |
| 2001 | January | Q1 | Reliance | 25000 |
| 2001 | February | Q1 | Reliance | 10000 |
| 2001 | March | Q1 | Reliance | 15000 |
| 2001 | April | Q2 | Reliance | 50000 |
| 2001 | May | Q2 | Reliance | 50000 |
| 2001 | June | Q2 | Reliance | 50000 |
| 2001 | July | Q3 | Reliance | 50000 |
| 2001 | August | Q3 | Reliance | 50000 |
| 2001 | September | Q3 | Reliance | 50000 |
| 2001 | October | Q4 | Reliance | 50000 |
| 2001 | November | Q4 | Reliance | 50000 |
| 2001 | December | Q4 | Reliance | 50000 |
| 2002 | January | Q1 | Tata | 15000 |
| 2002 | February | Q1 | Tata | 15000 |
| 2002 | March | Q1 | Tata | 15000 |
| 2002 | April | Q2 | Tata | 25000 |
| 2002 | May | Q2 | Tata | 25000 |
| 2002 | June | Q2 | Tata | 25000 |
| 2002 | July | Q3 | Tata | 20000 |
| 2002 | August | Q3 | Tata | 20000 |
| 2002 | September | Q3 | Tata | 30000 |
| 2002 | October | Q4 | Tata | 40000 |
| 2002 | November | Q4 | Tata | 15000 |
| 2002 | December | Q4 | Tata | 15000 |
| 2002 | January | Q1 | Barclay | 400000 |
| 2002 | February | Q1 | Barclay | 100000 |
| 2002 | March | Q1 | Barclay | 100000 |
| 2002 | April | Q2 | Barclay | 150000 |
| 2002 | May | Q2 | Barclay | 70000 |
| 2002 | June | Q2 | Barclay | 80000 |
| 2002 | July | Q3 | Barclay | 100000 |
| 2002 | August | Q3 | Barclay | 25000 |
| 2002 | September | Q3 | Barclay | 25000 |
| 2002 | October | Q4 | Barclay | 50000 |
| 2002 | November | Q4 | Barclay | 50000 |
| 2002 | December | Q4 | Barclay | 50000 |
| 2002 | January | Q1 | Reliance | 3000 |
| 2002 | February | Q1 | Reliance | 3000 |
| 2002 | March | Q1 | Reliance | 4000 |
| 2002 | April | Q2 | Reliance | 20000 |
| 2002 | May | Q2 | Reliance | 10000 |
| 2002 | June | Q2 | Reliance | 10000 |
| 2002 | July | Q3 | Reliance | 10000 |
| 2002 | August | Q3 | Reliance | 10000 |
| 2002 | September | Q3 | Reliance | 5000 |
| 2002 | October | Q4 | Reliance | 5000 |
| 2002 | November | Q4 | Reliance | 10000 |
| 2002 | December | Q4 | Reliance | 10000 |
I wat to show my record in group Like -
Name- Tata
coloumn1 column2 column3
-------------------------------------------------------------------
Subtotal-
-------------------------------------------------------------------
Name - Barclay
coloumn1 column2 column3
-------------------------------------------------------------------
Subtotal-
-------------------------------------------------------------------
Name- Reliance
coloumn1 column2 column3
-------------------------------------------------------------------
Subtotal-
-------------------------------------------------------------------
-------------------------------------------------------------------
Grand Total-
-------------------------------------------------------------------
How can i do this one,Please help me.
Right now i have created one table object where i have taked columns and then i am coping my object i report but i am unable to generate Group subtotal.
Thanks in Advance.
- « Previous Replies
-
- 1
- 2
- Next Replies »
Accepted Solutions
- Mark as New
- Bookmark
- Subscribe
- Mute
- Subscribe to RSS Feed
- Permalink
- Report Inappropriate Content
Hi,
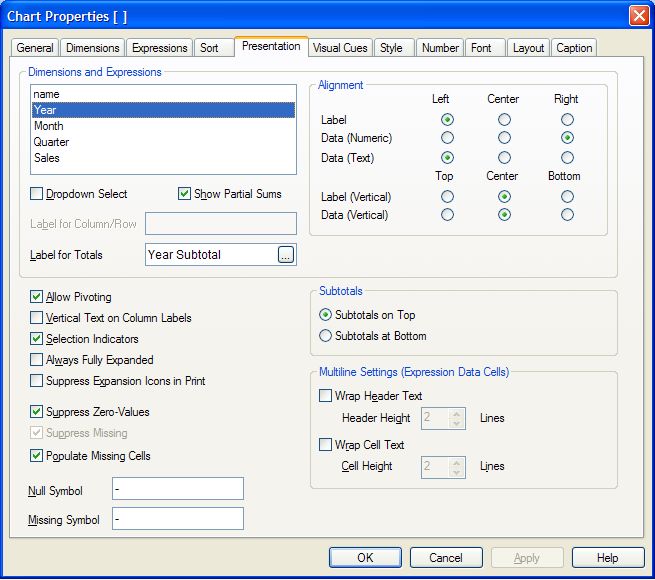
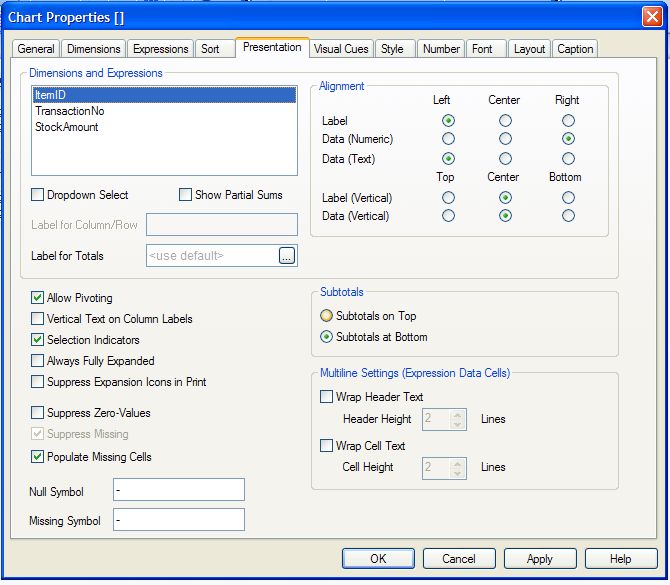
Thanks, When you go to Presentation tab there you see Dimension and Expression, there when you select Year below the optons you see the Label for Totals tex box type Subtotal there
See the snapshots.
Regards
Anand
- Mark as New
- Bookmark
- Subscribe
- Mute
- Subscribe to RSS Feed
- Permalink
- Report Inappropriate Content
Hi,
Sub total option available in pivot table in
Presentation -> Subtotals -> select Top/Bottom
Regards
Anand
- Mark as New
- Bookmark
- Subscribe
- Mute
- Subscribe to RSS Feed
- Permalink
- Report Inappropriate Content
Hi,
See the attached sample file it will explain what you requires with subtotal at year level if you want it on Name, Month, Quarter level you can do that.
Regards,
Anand
- Mark as New
- Bookmark
- Subscribe
- Mute
- Subscribe to RSS Feed
- Permalink
- Report Inappropriate Content
Thanks for Reply Anandrjs,
but still i am not getting that option.
I have only one option in Properties -->Presentation -->Total--> Total On First Row/ Total on Last Row
But i want sub total on group basis.
I cant open that QVW file.
What i created is :
Go to new Sheet Object -->Chart -->Allowoing Type-->Pivot Table .
then i am selecting my dimentions.
but in Presentation tab i am not getting that option.
If i am wrong please correct me.
Thanks.
- Mark as New
- Bookmark
- Subscribe
- Mute
- Subscribe to RSS Feed
- Permalink
- Report Inappropriate Content
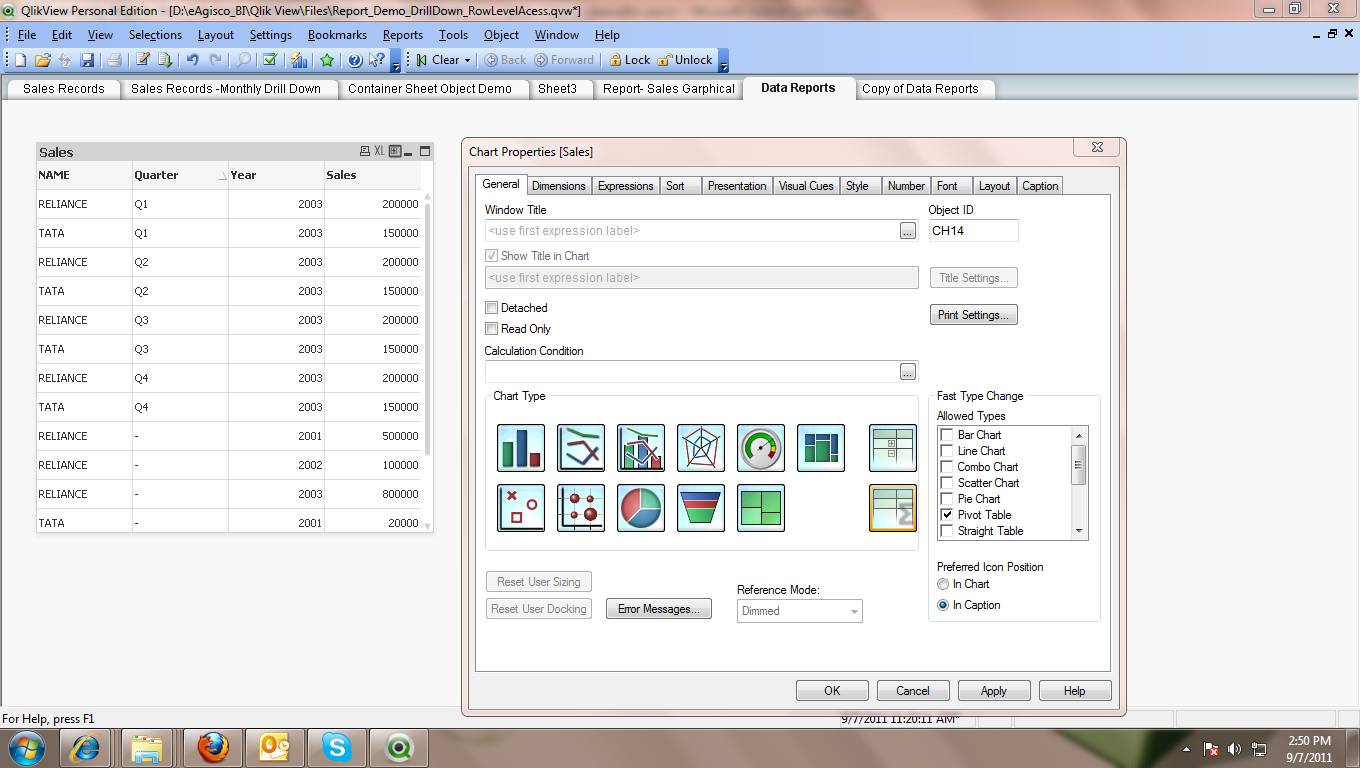
Hi,
You need to change the type of chart from straight table to pivot table the option you say it is for Properties -->Presentation -->Total--> Total On First Row/ Total on Last Row straight table only. By right click on properties and change the type of chart from general tab there is a many option then go to apply.
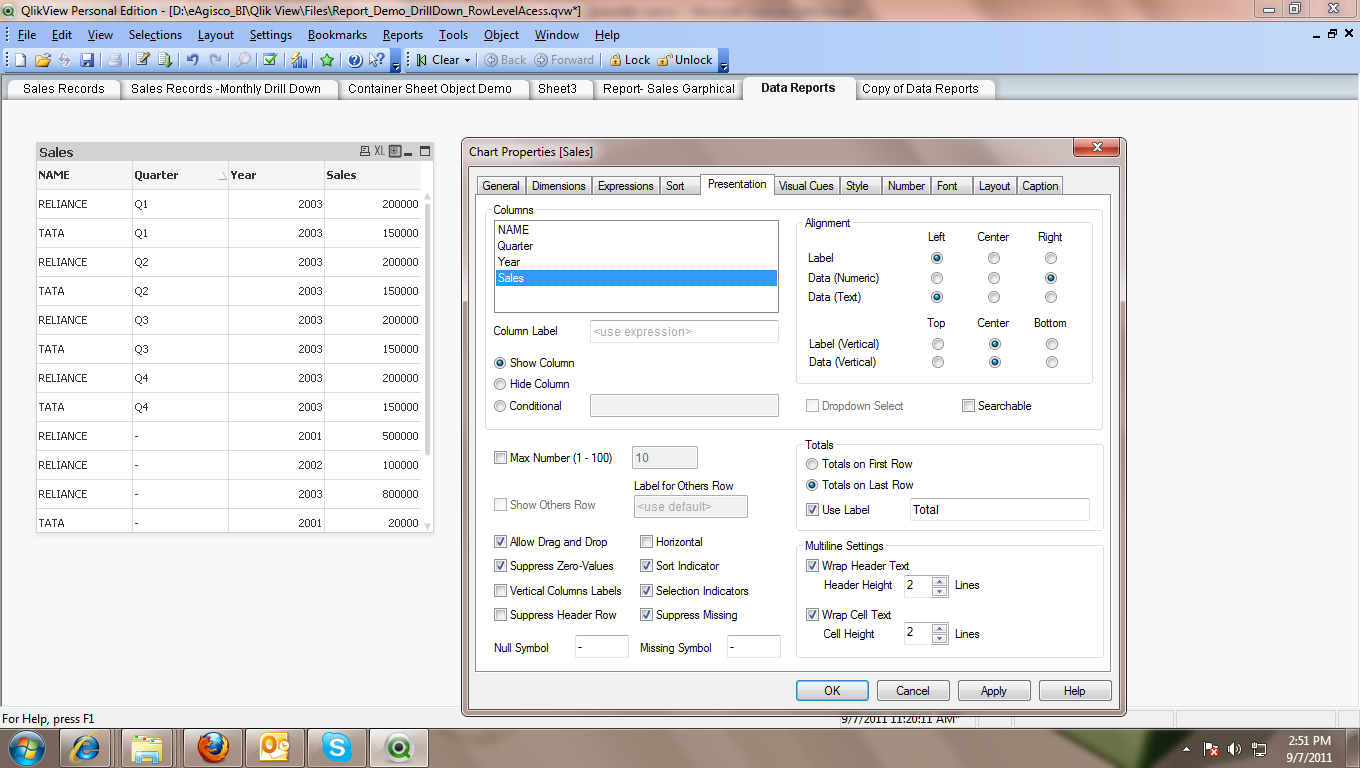
After that go to presentation tab there you see options Subtotal on top/ Subtotal on bottom.
Regards
Anand
- Mark as New
- Bookmark
- Subscribe
- Mute
- Subscribe to RSS Feed
- Permalink
- Report Inappropriate Content
Hi Anand,
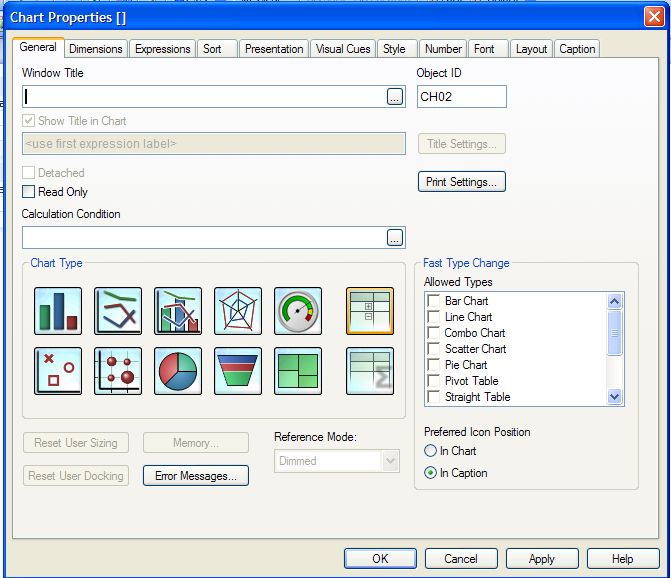
Still i am not getting Option.I have already choose Pivot table option in General but presentaion tab is showing
same option please find the attachment and see images,
General Tab:
Presentaion Tab:
please check where i am wrong.
Thanks.
- Mark as New
- Bookmark
- Subscribe
- Mute
- Subscribe to RSS Feed
- Permalink
- Report Inappropriate Content
Hi,
See the snapshots of the Pivot table selected on upfront to the straight table is pivot table and in second image subtotals display.
And let me know if you got any problem
Regards
Anand
- Mark as New
- Bookmark
- Subscribe
- Mute
- Subscribe to RSS Feed
- Permalink
- Report Inappropriate Content
hello gaurav you need to check on radio button "Subtotal on top"
go to presentation-> select below fields in left pane one by one
Year | Month | Quarter | Name |
and select check show partial sum and subtotal on top
hope thiss helps You
- Mark as New
- Bookmark
- Subscribe
- Mute
- Subscribe to RSS Feed
- Permalink
- Report Inappropriate Content
Hi Gaurav,
You got information from snapshots, if show let me know about that.
Regards,
Anand
- Mark as New
- Bookmark
- Subscribe
- Mute
- Subscribe to RSS Feed
- Permalink
- Report Inappropriate Content
Hi Anand,
Thankyou very much foo response.
I got your snapshots and it's working, but not completely .How can we show Name only once's in a group like:
Name- Tata
coloumn1 column2 column3
-------------------------------------------------------------------
Subtotal-
And also how can i add Label like 'SubTotal-'.
- « Previous Replies
-
- 1
- 2
- Next Replies »