Unlock a world of possibilities! Login now and discover the exclusive benefits awaiting you.
- Qlik Community
- :
- All Forums
- :
- QlikView App Dev
- :
- Why is the frequency greyed out in a list box?
- Subscribe to RSS Feed
- Mark Topic as New
- Mark Topic as Read
- Float this Topic for Current User
- Bookmark
- Subscribe
- Mute
- Printer Friendly Page
- Mark as New
- Bookmark
- Subscribe
- Mute
- Subscribe to RSS Feed
- Permalink
- Report Inappropriate Content
Why is the frequency greyed out in a list box?
Hi All
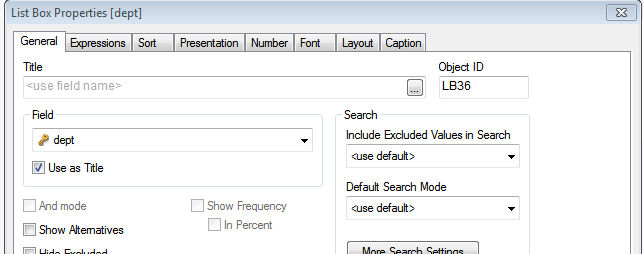
List box was working fine .... but now the frequency is "greyed out" - any idea why?
It did before give me the ability to choose frequency as per another dimension:
thank you
Jo
- Mark as New
- Bookmark
- Subscribe
- Mute
- Subscribe to RSS Feed
- Permalink
- Report Inappropriate Content
I think it's greyed out because you are using a list box for a key field.
A frequency count on a key field is not well defined, AFAIK, and I think Qlik disabled the option to avoid confusion.
I have seen the option on key field not disabled a couple of times, though, but I guess that's a bug, unless there was a feature change I am not aware of.
- Mark as New
- Bookmark
- Subscribe
- Mute
- Subscribe to RSS Feed
- Permalink
- Report Inappropriate Content
but it was a key field yesterday and I could get the frequency ...
- Mark as New
- Bookmark
- Subscribe
- Mute
- Subscribe to RSS Feed
- Permalink
- Report Inappropriate Content
It is not allowed on Key field and input fields...
- Mark as New
- Bookmark
- Subscribe
- Mute
- Subscribe to RSS Feed
- Permalink
- Report Inappropriate Content
Would you be above to provide the Application?
Or
Use this dimension =Only(dept) then check? Or not share the application and how your DM and script?
- Mark as New
- Bookmark
- Subscribe
- Mute
- Subscribe to RSS Feed
- Permalink
- Report Inappropriate Content
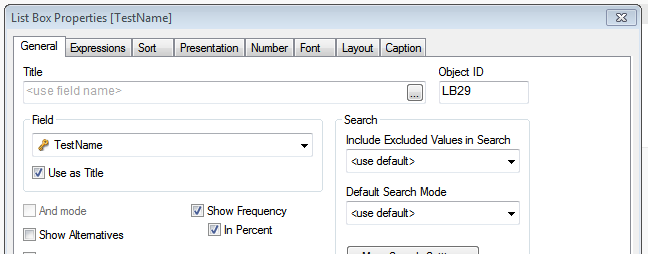
As far as I can see, a key field will usually have the Frequency disabled, unless come combination of these occurs:
the field is a unique key in at least one table
one table contains 100% of the possible values
YMMV, and it is hard to predict when the key is to multiple tables. In general though, you can't do frequencies with a key field, just like Count() can be unpredictable and you need to use Count(DISTINCT...) on a key field.
- Mark as New
- Bookmark
- Subscribe
- Mute
- Subscribe to RSS Feed
- Permalink
- Report Inappropriate Content
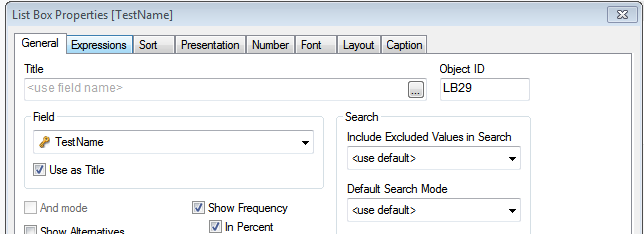
This is a key field and it is not greyed out
- Mark as New
- Bookmark
- Subscribe
- Mute
- Subscribe to RSS Feed
- Permalink
- Report Inappropriate Content
Jonathan,
is the condition when to disable / enable the frequency option on key fields documented somewhere?
Or have you just discovered this by yourself?
AFAIR, the old help system was telling that the list box option is disabled on key fields (I may be wrong), and frankly, I don't fully understand the new help description:
| Show Frequency | Toggles the status for whether the frequency of a field value is shown or not. By frequency is meant the number of selectable combinations in which the value occurs. This option is not available for calculated fields.
|
- Mark as New
- Bookmark
- Subscribe
- Mute
- Subscribe to RSS Feed
- Permalink
- Report Inappropriate Content
Originally it was one flat file ... then I added another couple of flat files And I had saved the original flat file as a QVD file.
As I was just starting this dashboard I thought it would be useful to be able to see the highest frequency of events. It gives me a "feel" for the data when I am unfamiliar with it. So maybe it is a combination of events.
Jo
- Mark as New
- Bookmark
- Subscribe
- Mute
- Subscribe to RSS Feed
- Permalink
- Report Inappropriate Content
>>Or have you just discovered this by yourself?
@Stefan
I have not seen any documentation, but in investigating this post, I built a small test model with three tables and a couple of key fields and these were my findings. As this not official, it would be best not to rely on this behaviour as it may be version specific (11.2 SR9 here).
