Unlock a world of possibilities! Login now and discover the exclusive benefits awaiting you.
- Qlik Community
- :
- All Forums
- :
- QlikView App Dev
- :
- Wrap Legends in bar chart
- Subscribe to RSS Feed
- Mark Topic as New
- Mark Topic as Read
- Float this Topic for Current User
- Bookmark
- Subscribe
- Mute
- Printer Friendly Page
- Mark as New
- Bookmark
- Subscribe
- Mute
- Subscribe to RSS Feed
- Permalink
- Report Inappropriate Content
Wrap Legends in bar chart
Hi All,
Can we wrap the legends of a bar chart?
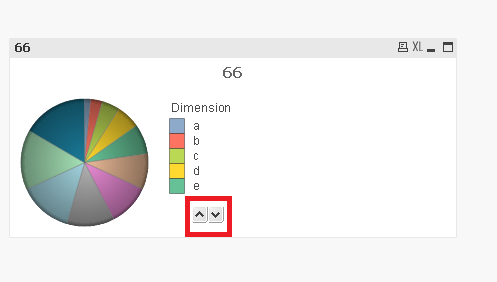
By wrap, i don't mean wrapping the text of the legends but i want that there should be two rows of the legends as we want to see all the values at one time rather than using arrows to scroll up or down.
Please tell me if there is any way to do this.
- « Previous Replies
-
- 1
- 2
- Next Replies »
Accepted Solutions
- Mark as New
- Bookmark
- Subscribe
- Mute
- Subscribe to RSS Feed
- Permalink
- Report Inappropriate Content
Make sense, But we can't do with single object as per your need. But, we can make diff objects and then club into one
First Approach: Second Approach:
Note: Which approach you liked it, In the second option you may not get with the color prompt which shows in Pie chart legend, And here i've done with List box called the calculated expression Aggr(FieldName, FieldName) and i did custom on layout. Even, If we changed the sort from User then it should change like below
Note: If you don't want green selector that we have control to change.
- Mark as New
- Bookmark
- Subscribe
- Mute
- Subscribe to RSS Feed
- Permalink
- Report Inappropriate Content
Hello Chhavi,
Please refer attached sample application.
Regards!
Rahul
- Mark as New
- Bookmark
- Subscribe
- Mute
- Subscribe to RSS Feed
- Permalink
- Report Inappropriate Content
Hey,
i think you misunderstood.
I want to avoid these arrows which i have highlighted in red, and i want the legends to be displayed in two columns.

- Mark as New
- Bookmark
- Subscribe
- Mute
- Subscribe to RSS Feed
- Permalink
- Report Inappropriate Content
May be mouse over to the Legend and drag to the height of the legend
Or move to the down and move into the Horizontal
- Mark as New
- Bookmark
- Subscribe
- Mute
- Subscribe to RSS Feed
- Permalink
- Report Inappropriate Content
Hello Chhavi,
Select the chart and press Ctrl + Shift; post that resize the height of legend.
Hope this will help you.
Regards!
Rahul
- Mark as New
- Bookmark
- Subscribe
- Mute
- Subscribe to RSS Feed
- Permalink
- Report Inappropriate Content
Actually the number of values in the legends are more, i have tried to increase the height as well, but it still doesnt fit in. and i cannot increase the height of the chart.
Horizontal is also not working.
So i was looking for an alternative, may be if i could distribute it into 2 columns. But i am not able to achieve that
- Mark as New
- Bookmark
- Subscribe
- Mute
- Subscribe to RSS Feed
- Permalink
- Report Inappropriate Content
Make sense, But we can't do with single object as per your need. But, we can make diff objects and then club into one
First Approach: Second Approach:
Note: Which approach you liked it, In the second option you may not get with the color prompt which shows in Pie chart legend, And here i've done with List box called the calculated expression Aggr(FieldName, FieldName) and i did custom on layout. Even, If we changed the sort from User then it should change like below
Note: If you don't want green selector that we have control to change.
- Mark as New
- Bookmark
- Subscribe
- Mute
- Subscribe to RSS Feed
- Permalink
- Report Inappropriate Content
Hello Chhavi,
You can make use of Restrict which values are displayed using the first expression option present under Dimension Limit tab of chart properties. Select Show only option with Largest 10 values. The Largest option returns the rows in descending order based on the first expression in the chart.
Select Show Others option to produce an Others segment in the chart. All dimension values that do not meet the comparison criteria for the display restrictions will be grouped into the Others segment.
Once done with this then you can see the Top 10 values including Others. If you want to know more about Others then you can click on Others this Top 10 values present under Others (This will create new Others within Others) and so on.
Hope this will help.
Regards!
Rahul
- Mark as New
- Bookmark
- Subscribe
- Mute
- Subscribe to RSS Feed
- Permalink
- Report Inappropriate Content
Okay, thanks ![]()
- Mark as New
- Bookmark
- Subscribe
- Mute
- Subscribe to RSS Feed
- Permalink
- Report Inappropriate Content
thanks!
- « Previous Replies
-
- 1
- 2
- Next Replies »