Unlock a world of possibilities! Login now and discover the exclusive benefits awaiting you.
- Qlik Community
- :
- All Forums
- :
- QlikView App Dev
- :
- Re: Year comparison for expressions
- Subscribe to RSS Feed
- Mark Topic as New
- Mark Topic as Read
- Float this Topic for Current User
- Bookmark
- Subscribe
- Mute
- Printer Friendly Page
- Mark as New
- Bookmark
- Subscribe
- Mute
- Subscribe to RSS Feed
- Permalink
- Report Inappropriate Content
Year comparison for expressions
Hello,
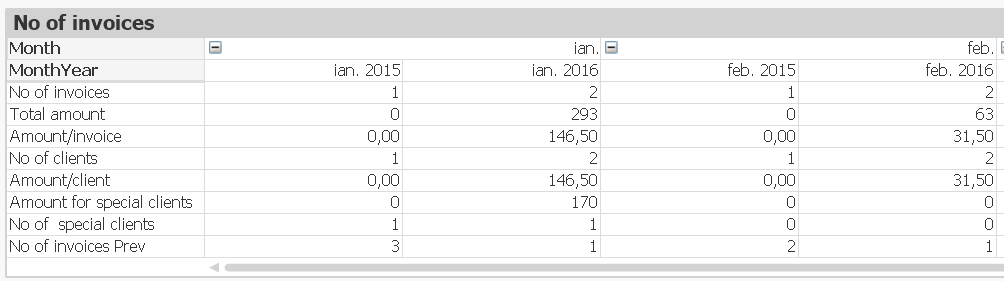
I have a pivot table with many expressions that are vertically arranged and a month dimension. I want to make a comparison with the same month last year, plus a quarter sum and I don't know how to do this for all expressions.
Now I have:
| - | Jan | Feb | Mar | Apr |
| Expression 1 | ||||
| Expression 2 | ||||
| Expression 3 | ||||
| Expression 4 | ||||
| Expression 5 |
And I want to obtain:
| - | Jan 2016 | Jan 2015 | Jan % | Feb 2016 | Feb 2015 | Feb % | Mar 2016 | Mar 2015 | Mar % | Q1 2016 | Q1 2015 | Q1 % |
| Expression 1 | ||||||||||||
| Expression 2 | ||||||||||||
| Expression 3 | ||||||||||||
| Expression 4 | ||||||||||||
| Expression 5 |
Any ideas?
Thank you!
- Mark as New
- Bookmark
- Subscribe
- Mute
- Subscribe to RSS Feed
- Permalink
- Report Inappropriate Content
You can user alternate states for your situation.
Easy for me to say  , can you upload qvw?
- Mark as New
- Bookmark
- Subscribe
- Mute
- Subscribe to RSS Feed
- Permalink
- Report Inappropriate Content
I made a simplified sample with just one table and some expressions. Actually there are many other expressions and columns. Can you help me to compare every epression with the same expression last year?
- Mark as New
- Bookmark
- Subscribe
- Mute
- Subscribe to RSS Feed
- Permalink
- Report Inappropriate Content
I have created seperate calendar date data in excel spreadsheet which has two years (2015&2016) data.
Attached qvw & excel.
I have left months format as was uploaded.