Unlock a world of possibilities! Login now and discover the exclusive benefits awaiting you.
- Qlik Community
- :
- All Forums
- :
- QlikView App Dev
- :
- aggr condition in bar chart
- Subscribe to RSS Feed
- Mark Topic as New
- Mark Topic as Read
- Float this Topic for Current User
- Bookmark
- Subscribe
- Mute
- Printer Friendly Page
- Mark as New
- Bookmark
- Subscribe
- Mute
- Subscribe to RSS Feed
- Permalink
- Report Inappropriate Content
aggr condition in bar chart
Hi,
I have a issue in bar chart using aggr function when calculate the no. of vendors for each part and company_site
The dimension is:
=if(aggr(Count(DISTINCT Vendor_Code), Part_Code,Company_Site)=1,
'1 Vendor',
aggr(Count(DISTINCT Vendor_Code), Part_Code,Company_Site)&' Vendors')
And the expression is:
Count(DISTINCT Part_Code)
So the bar chart is below, and link to category detail table. Now the Company Site and Part Number column is not selected
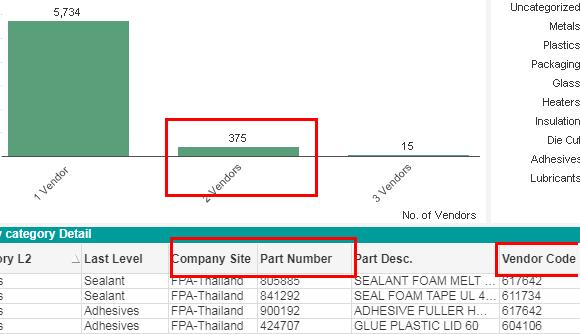
The issue is when click the 2 Vendors in bar chart, 1 Vendor has appeared. Normally, this should not appear.
Owing to the third record, Company Site and Part Number has only one Vendor.
The first and second record is what I want when I click the bar chart.
Can anybody help me to fix this issue? Thanks.
Accepted Solutions
- Mark as New
- Bookmark
- Subscribe
- Mute
- Subscribe to RSS Feed
- Permalink
- Report Inappropriate Content
Create a new field in the script using this
LOAD AutoNumber(Part_Code&Company_Site) as Key,
and then try this as your dimension
=If(Aggr(Count(DISTINCT Vendor_Code), Key) = 1, '1 Vendor', Aggr(Count(DISTINCT Vendor_Code), Key)&' Vendors')
- Mark as New
- Bookmark
- Subscribe
- Mute
- Subscribe to RSS Feed
- Permalink
- Report Inappropriate Content
Thank Sunny, the Part_Code and Company_Site is in different table, I will try to modify the data model.
- Mark as New
- Bookmark
- Subscribe
- Mute
- Subscribe to RSS Feed
- Permalink
- Report Inappropriate Content
It might be possible without changing the data model, but it will have to be tested, would you be able to share a sample?
- Mark as New
- Bookmark
- Subscribe
- Mute
- Subscribe to RSS Feed
- Permalink
- Report Inappropriate Content
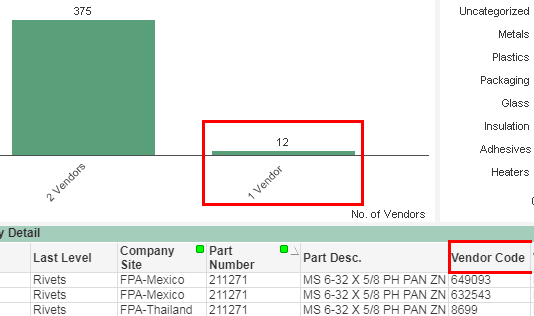
I have create a demo.qvw, but the issue is it appear 3 Vendors when click the 1 Vendor
- Mark as New
- Bookmark
- Subscribe
- Mute
- Subscribe to RSS Feed
- Permalink
- Report Inappropriate Content
I have change the data model, and it working well, Thank you again.