Unlock a world of possibilities! Login now and discover the exclusive benefits awaiting you.
- Qlik Community
- :
- All Forums
- :
- QlikView App Dev
- :
- Re: bar-line chart showing percent
- Subscribe to RSS Feed
- Mark Topic as New
- Mark Topic as Read
- Float this Topic for Current User
- Bookmark
- Subscribe
- Mute
- Printer Friendly Page
- Mark as New
- Bookmark
- Subscribe
- Mute
- Subscribe to RSS Feed
- Permalink
- Report Inappropriate Content
bar-line chart showing percent
Hi there,
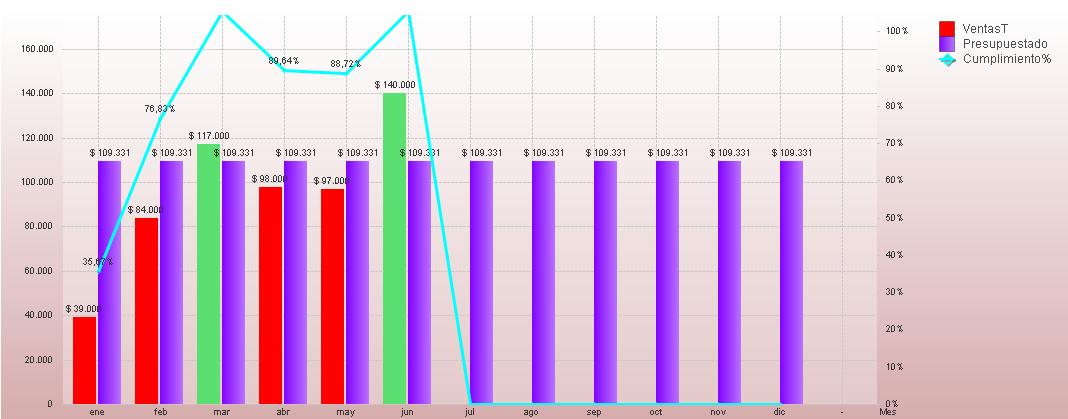
I am developing an application and one of the requirements is to have a chart that shows sales, budget and compliance (sales / budget) per month and per year.
Now I have the chart ready, however when I select a specific year compliance line is not displayed correctly, for further description send my chart if anyone can give me a hand.
Showing all years
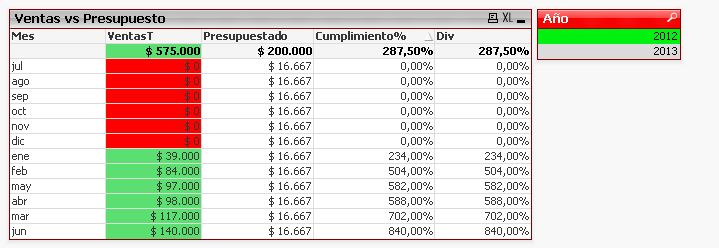
Showing a specific year

- Tags:
- line_bar_chart
Accepted Solutions
- Mark as New
- Bookmark
- Subscribe
- Mute
- Subscribe to RSS Feed
- Permalink
- Report Inappropriate Content
It is working for the expression you have entered, but you have the axis set to a static max of 1 and some of your values are over 200%. Ex:
- Mark as New
- Bookmark
- Subscribe
- Mute
- Subscribe to RSS Feed
- Permalink
- Report Inappropriate Content
It is working for the expression you have entered, but you have the axis set to a static max of 1 and some of your values are over 200%. Ex:
- Mark as New
- Bookmark
- Subscribe
- Mute
- Subscribe to RSS Feed
- Permalink
- Report Inappropriate Content
Thank you for your help,
I also want to know how I can automaticaly set the axis scale depending on the highest value of complianse (cumplimiento).
I appreciate your help 
- Mark as New
- Bookmark
- Subscribe
- Mute
- Subscribe to RSS Feed
- Permalink
- Report Inappropriate Content
I just find the way, I put on the axis scale the same expression of complianse using max()....
Thanks
- Mark as New
- Bookmark
- Subscribe
- Mute
- Subscribe to RSS Feed
- Permalink
- Report Inappropriate Content
No prob. Glad you figured it out.