Unlock a world of possibilities! Login now and discover the exclusive benefits awaiting you.
- Qlik Community
- :
- All Forums
- :
- QlikView App Dev
- :
- change view of bar chart
Options
- Subscribe to RSS Feed
- Mark Topic as New
- Mark Topic as Read
- Float this Topic for Current User
- Bookmark
- Subscribe
- Mute
- Printer Friendly Page
Turn on suggestions
Auto-suggest helps you quickly narrow down your search results by suggesting possible matches as you type.
Showing results for
Creator II
2015-11-30
08:23 AM
- Mark as New
- Bookmark
- Subscribe
- Mute
- Subscribe to RSS Feed
- Permalink
- Report Inappropriate Content
change view of bar chart
Hello,
I need to change the show of bar chart.
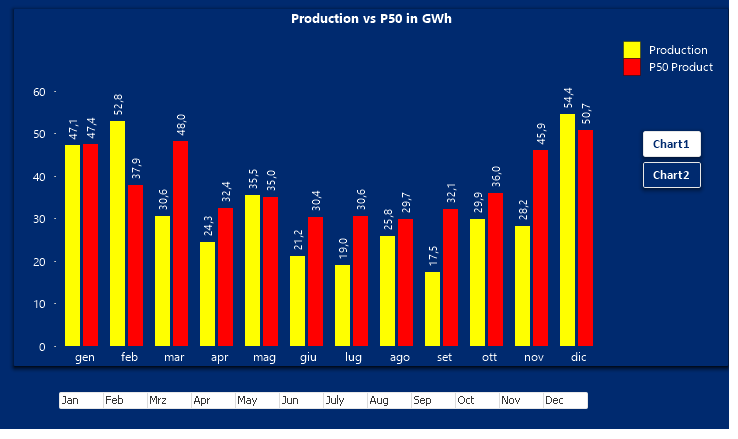
I have this bar chart and when I select a month (January for example) I have the normal view :
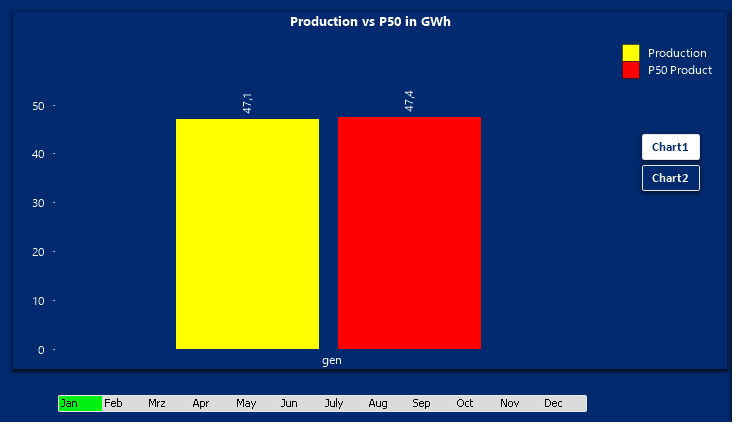
I need to have a view like this
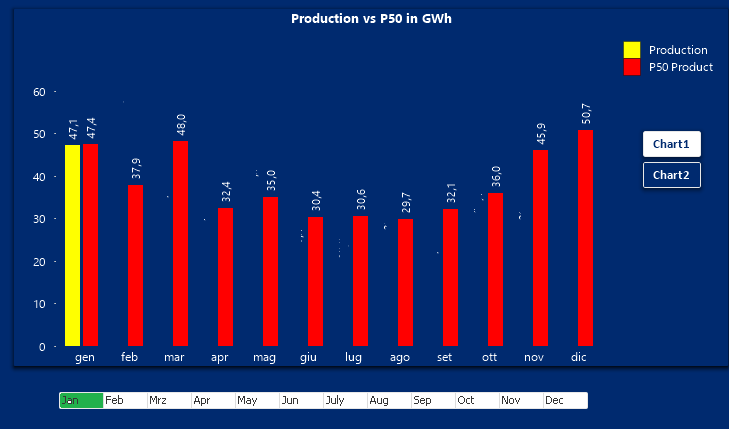
The expression of Production change with my selection and the P50 is fixed.
Someone know if is possible to have this effect?
Regards
Pasquale
311 Views
1 Reply
MVP
2015-11-30
12:47 PM
- Mark as New
- Bookmark
- Subscribe
- Mute
- Subscribe to RSS Feed
- Permalink
- Report Inappropriate Content
Please try to avoid posting multiple times the same topic.
You've already received some answers here:
246 Views