Unlock a world of possibilities! Login now and discover the exclusive benefits awaiting you.
- Qlik Community
- :
- All Forums
- :
- QlikView App Dev
- :
- Re: charts and dimension
- Subscribe to RSS Feed
- Mark Topic as New
- Mark Topic as Read
- Float this Topic for Current User
- Bookmark
- Subscribe
- Mute
- Printer Friendly Page
- Mark as New
- Bookmark
- Subscribe
- Mute
- Subscribe to RSS Feed
- Permalink
- Report Inappropriate Content
charts and dimension
Hi All,
I want to know how many charts in Qlikview and how much dimension we can use for each chart.
Pleas do the needful.
Thanks,
- « Previous Replies
-
- 1
- 2
- Next Replies »
- Mark as New
- Bookmark
- Subscribe
- Mute
- Subscribe to RSS Feed
- Permalink
- Report Inappropriate Content
Go to
C:\Program Files\QlikView\Examples\Documents
you will get Data Visualization.qvw....
All charts mentioned there.....
- Mark as New
- Bookmark
- Subscribe
- Mute
- Subscribe to RSS Feed
- Permalink
- Report Inappropriate Content
I know that but i want to know how many dimension we can use for each chart.
e.g. Gauge chart - no dimension ...........
- Mark as New
- Bookmark
- Subscribe
- Mute
- Subscribe to RSS Feed
- Permalink
- Report Inappropriate Content
Hi Vijay,
Try looking at the qlikview reference manual try looking in:
C:\ProgramData\QlikTech\QlikView Documentation\Reference Manual
Or do you mean for qlik sense ?
For qlik sense try the online help:
http://help.qlik.com/sense/en-us/online/#
For example, for the bar chart:
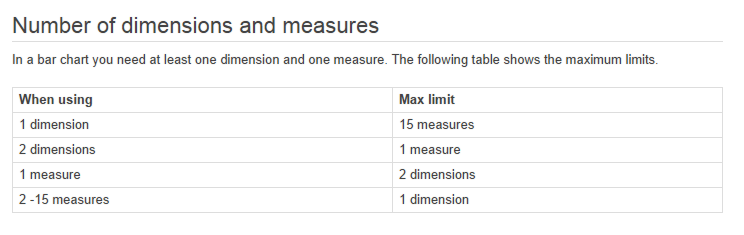
Thanks
Mark
- Mark as New
- Bookmark
- Subscribe
- Mute
- Subscribe to RSS Feed
- Permalink
- Report Inappropriate Content
waiting for reply...
- Mark as New
- Bookmark
- Subscribe
- Mute
- Subscribe to RSS Feed
- Permalink
- Report Inappropriate Content
| Chart | Max Dimensions |
| Bar | 3 |
| Line | 2 |
| Radar | 1 |
| Gauge | 0 |
| Scatter | 2 |
| Grid | 3 |
| Pie | 2 |
- Mark as New
- Bookmark
- Subscribe
- Mute
- Subscribe to RSS Feed
- Permalink
- Report Inappropriate Content
Thanks very much Manish....
- Mark as New
- Bookmark
- Subscribe
- Mute
- Subscribe to RSS Feed
- Permalink
- Report Inappropriate Content
And what about Funnel,Block chart...
and how many expression we can use in the above charts
- Mark as New
- Bookmark
- Subscribe
- Mute
- Subscribe to RSS Feed
- Permalink
- Report Inappropriate Content
copied from Qlik reference manual, version 11, page 600
A chart can display one or more dimensions. The upper limit depends on the actual chart type, the complexity
of the data and the available memory. Pie, line and scatter charts can display a maximum of two
dimensions, bar, block and grid charts three. Radar charts can only display a single dimension, and gauge
charts use no dimensions at all. A funnel chart typically has one to three dimensions. Further dimensions are
ignored.
- Mark as New
- Bookmark
- Subscribe
- Mute
- Subscribe to RSS Feed
- Permalink
- Report Inappropriate Content
Why do you need to know the max limit? Are you experiencing problems with a specific chart?
The nature of a chart usually gives an indication of what a suitable setup is. For example a Gauge shows a measure, so naturally it makes no sense to stretch the calculation over dimensional values. A bar chart shows measures for different dimensional values, so naturally it requires a dimension. Multiple dimensions in a bar chart makes it more cluttered and harder to use, so two dimensions usually is a good limit.
The way you set up a chart, considering dimensions and expressions, will lead to different amount of memory usage and calculation requirements. The number of dimensions that you add can therefore impact the usability of a chart object, and make the object better or worse in terms of usability.
---
Please remember to mark answers as helpful or correct, so that community members know if your questions needs more attention or not. I moved this question from the Qlik Sense forum to the QlikView forum.
- « Previous Replies
-
- 1
- 2
- Next Replies »