Unlock a world of possibilities! Login now and discover the exclusive benefits awaiting you.
- Qlik Community
- :
- All Forums
- :
- QlikView App Dev
- :
- Re: check the date in the period
- Subscribe to RSS Feed
- Mark Topic as New
- Mark Topic as Read
- Float this Topic for Current User
- Bookmark
- Subscribe
- Mute
- Printer Friendly Page
- Mark as New
- Bookmark
- Subscribe
- Mute
- Subscribe to RSS Feed
- Permalink
- Report Inappropriate Content
check the date in the period
Help, please, beginner!)Sorry for my English
I have a list of employees with their absence in the form:
| Beginning | Expiration | |
|---|---|---|
| Employee 1 | 25.04.2017 | 25.04.2017 |
| Employee 2 | 17.07.2017 | 30.07.2017 |
| Employee 3 | 01.01.2015 | 31.12.2017 |
| Employee 4 | 07.10.2016 | 08.01.2017 |
| Employee 1 | 11.05.2017 | 17.05.2017 |
and there is a reference book with the beginning dates of the week and the names assigned to them, which are used as a sample, for example:
04/17/2017 W16
04/24/2017 W17
05/01/2017 W18
05/05/2017 W19
05/15/2017 W20
and by the choice of the name of the week (W17 for example), I need to count people in the graphs by the type of absence and by the months that this week is included in their period (Beginning-Expiration).
I would be very grateful!
- « Previous Replies
-
- 1
- 2
- Next Replies »
- Mark as New
- Bookmark
- Subscribe
- Mute
- Subscribe to RSS Feed
- Permalink
- Report Inappropriate Content
Hi,
What you need is Intervalmatch() function.
See below helpful links.
IntervalMatch Function in QlikView
Regards,
Kaushik solanki
- Mark as New
- Bookmark
- Subscribe
- Mute
- Subscribe to RSS Feed
- Permalink
- Report Inappropriate Content
Try:
CALENDAR:
LOAD * INLINE [
WeekKey,StartDate,WeekID
16,17/04/2017,W16
17,24/04/2017,W17
18,01/05/2017,W18
19,05/05/2017,W19
20,15/05/2017,W20
];
LOGIN:
LOAD
Week(Date(Date#(Begin, 'DD/MM/YYYY'))) as WeekKey,
Employee,
Date(Date#(Begin, 'DD/MM/YYYY')) as Begin,
Date(Date#(Expiration, 'DD/MM/YYYY')) as Expiration;
LOAD * INLINE [
Employee,Begin,Expiration
Employee1,25/04/2017,25/04/2017
Employee2,17/04/2017,18/04/2017
Employee3,01/05/2017,31/05/2017
Employee4,05/05/2017,08/05/2017
Employee1,15/05/2017,17/05/2017
];
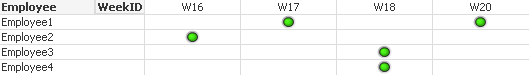
expression -> If(Count({1<WeekID={'*'}>} WeekID) > 0,1,' ')
- Mark as New
- Bookmark
- Subscribe
- Mute
- Subscribe to RSS Feed
- Permalink
- Report Inappropriate Content
Thank you very much for your prompt response.
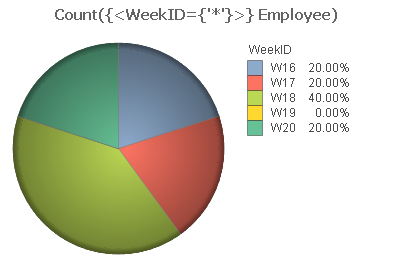
In the pie chart, it always shows 100% and does not divide by vacation types
- Mark as New
- Bookmark
- Subscribe
- Mute
- Subscribe to RSS Feed
- Permalink
- Report Inappropriate Content
Duplicate table, remove Employee dimension, change expression, chage chart type to pie.
- Mark as New
- Bookmark
- Subscribe
- Mute
- Subscribe to RSS Feed
- Permalink
- Report Inappropriate Content
Hello!
Yes, all cool I got to build a diagram, thanks to you.
But there are big periods from 2016 to 2017 for one person and it is necessary to check whether the week chosen in the filter is included in this period, and so your formula counts all who start the period enters this week
- Mark as New
- Bookmark
- Subscribe
- Mute
- Subscribe to RSS Feed
- Permalink
- Report Inappropriate Content
Hello!
This is a wonderful formula, thank you very much.
But how to make it pull out not a week, but the code of the week?
- Mark as New
- Bookmark
- Subscribe
- Mute
- Subscribe to RSS Feed
- Permalink
- Report Inappropriate Content
Hi!
Try...
Change expression in table chart to: If(Count({<WeekID={'*'}>} WeekID) > 0,1,' ')
Change expression in pie chart to: Count(Employee)
- Mark as New
- Bookmark
- Subscribe
- Mute
- Subscribe to RSS Feed
- Permalink
- Report Inappropriate Content
Maybe I do not understand how it works, but here's the picture I see:
There is an employee 1 he has the beginning of 20.03.2017, the end of 06.08.2017, and he shows on the table only W12, and should have shown all these weeks:
20.03.2017 W12
27.03.2017 W13
03.04.2017 W14
10.04.2017 W15
17.04.2017 W16
24.04.2017 W17
01.05.2017 W18
08.05.2017 W19
15.05.2017 W20
22.05.2017 W21
29.05.2017 W22
05.06.2017 W23
12.06.2017 W24
19.06.2017 W25
26.06.2017 W26
03.07.2017 W27
10.07.2017 W28
17.07.2017 W29
24.07.2017 W30
31.07.2017 W31
- Mark as New
- Bookmark
- Subscribe
- Mute
- Subscribe to RSS Feed
- Permalink
- Report Inappropriate Content
Sorry!
I did not understand what you need.
Please share your app so I can review it.
- « Previous Replies
-
- 1
- 2
- Next Replies »