Unlock a world of possibilities! Login now and discover the exclusive benefits awaiting you.
- Qlik Community
- :
- All Forums
- :
- QlikView App Dev
- :
- combining forecast sales to actual sales in line c...
- Subscribe to RSS Feed
- Mark Topic as New
- Mark Topic as Read
- Float this Topic for Current User
- Bookmark
- Subscribe
- Mute
- Printer Friendly Page
- Mark as New
- Bookmark
- Subscribe
- Mute
- Subscribe to RSS Feed
- Permalink
- Report Inappropriate Content
combining forecast sales to actual sales in line chart
Hi all,
i have 2 line charts, 1 showing actual sales (up to the end of the last period) and 1 showing forecast sales (from the current period to the end of the year).
i want to combine them so the forecast lines are dotted and continue from the point the actual sales end.
i can't seem to get this working, can anyone point me in the right direction please?
sample attached.
many thanks
!
Accepted Solutions
- Mark as New
- Bookmark
- Subscribe
- Mute
- Subscribe to RSS Feed
- Permalink
- Report Inappropriate Content
May be this
Expression
RangeSum(
sum({<Period={">=$(=GetFieldSelections(Period))"}>}[Forecast Volume]),
sum({<Period={"<$(=GetFieldSelections(Period))"}>} [Sales Value]))
Line Style expression
If(Only({<Period={">=$(=GetFieldSelections(Period))"}>}Period), '<S2>')

- Mark as New
- Bookmark
- Subscribe
- Mute
- Subscribe to RSS Feed
- Permalink
- Report Inappropriate Content
It is very difficult to escape a selection in a field that you also use as a dimension.
The example in attachment tries to sneak in by setting the tipping point using a variable instead of a selection in your Period field. The expression now adds Sales (periods before selected period) to Forecast (later periods), so that you can manipulate the line style of a single expression. Otherwise 2 dimensions and 2 expression will wreak havoc.
- Mark as New
- Bookmark
- Subscribe
- Mute
- Subscribe to RSS Feed
- Permalink
- Report Inappropriate Content
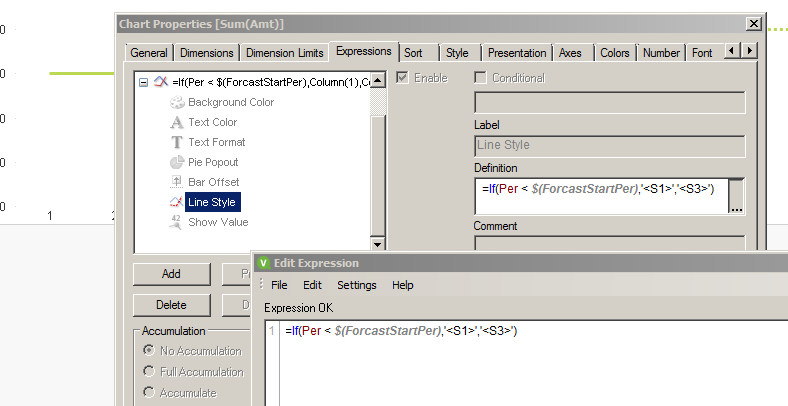
You could hide the actuals and forecast columns and use a third column that displays either actuals or forecast based on the period Modify the "Line Style" to pick either solid or dotted line. I created a variable to hold the starting forecast period so that I only had to change it in 1 place.
 .
.
- Mark as New
- Bookmark
- Subscribe
- Mute
- Subscribe to RSS Feed
- Permalink
- Report Inappropriate Content
Hi Peter, i can't get this to work as there will always be a period selected. it works when no period is selected but as soon as i make a selection the dashed forecast lines change to just that period.
- Mark as New
- Bookmark
- Subscribe
- Mute
- Subscribe to RSS Feed
- Permalink
- Report Inappropriate Content
Hi Jerry,
i can't get this to work in my example, i get this..

- Mark as New
- Bookmark
- Subscribe
- Mute
- Subscribe to RSS Feed
- Permalink
- Report Inappropriate Content
May be this
Expression
RangeSum(
sum({<Period={">=$(=GetFieldSelections(Period))"}>}[Forecast Volume]),
sum({<Period={"<$(=GetFieldSelections(Period))"}>} [Sales Value]))
Line Style expression
If(Only({<Period={">=$(=GetFieldSelections(Period))"}>}Period), '<S2>')
- Mark as New
- Bookmark
- Subscribe
- Mute
- Subscribe to RSS Feed
- Permalink
- Report Inappropriate Content
You've come to my rescue once again!
thanks Sunny!
- Mark as New
- Bookmark
- Subscribe
- Mute
- Subscribe to RSS Feed
- Permalink
- Report Inappropriate Content
Even simpler line style expression:
IF (Only({1} Period) >= GetFieldSelections(Period), '<S2>')