Unlock a world of possibilities! Login now and discover the exclusive benefits awaiting you.
- Qlik Community
- :
- All Forums
- :
- QlikView App Dev
- :
- Re: evolution for the last 24 months
- Subscribe to RSS Feed
- Mark Topic as New
- Mark Topic as Read
- Float this Topic for Current User
- Bookmark
- Subscribe
- Mute
- Printer Friendly Page
- Mark as New
- Bookmark
- Subscribe
- Mute
- Subscribe to RSS Feed
- Permalink
- Report Inappropriate Content
evolution for the last 24 months
Hello Guys 
I need a graph that contains the evolution of my KPI for the past 24 months
here's my graph :
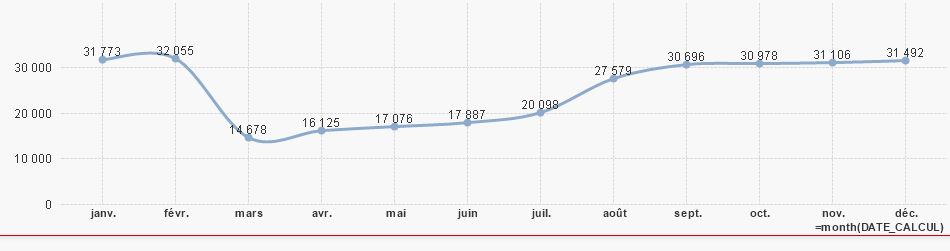
my expression : month(DATE_CALCUL) and date calcul has this format : DD/MM/YYYY
- Mark as New
- Bookmark
- Subscribe
- Mute
- Subscribe to RSS Feed
- Permalink
- Report Inappropriate Content
read this post
If a post helps to resolve your issue, please accept it as a Solution.
- Mark as New
- Bookmark
- Subscribe
- Mute
- Subscribe to RSS Feed
- Permalink
- Report Inappropriate Content
Last 24 months for what? While selection you need <24 Months? Can you describe more
- Mark as New
- Bookmark
- Subscribe
- Mute
- Subscribe to RSS Feed
- Permalink
- Report Inappropriate Content
Dear Weim
I have an idea
your chart can calculate all months value but shows last 24 months (actually it has not good performance but solve your problem)
for this can set "when number of item exceeds" =24 in presentation tab and this macro to save scroll of chart at right the macro as below:
set chart = ActiveDocument.GetSheetObject("CH01")
set chartProperties = chart.GetProperties
chartProperties.ChartProperties.XScrollInitRight = true
chart.SetProperties chartProperties
I prepare sample for u but I show the last 4 months value
hope it is helpful for u
- Mark as New
- Bookmark
- Subscribe
- Mute
- Subscribe to RSS Feed
- Permalink
- Report Inappropriate Content
Thank you Samane, will try and let you know