Unlock a world of possibilities! Login now and discover the exclusive benefits awaiting you.
- Qlik Community
- :
- All Forums
- :
- QlikView App Dev
- :
- forecast issues
- Subscribe to RSS Feed
- Mark Topic as New
- Mark Topic as Read
- Float this Topic for Current User
- Bookmark
- Subscribe
- Mute
- Printer Friendly Page
- Mark as New
- Bookmark
- Subscribe
- Mute
- Subscribe to RSS Feed
- Permalink
- Report Inappropriate Content
forecast issues
Hi
Im trying to set up a forecast, based on AVG of each particular day based on a month span, projected towards Monthsend.
did try the Linear regression but thats sums, and AVG didnt give that much of a good value for it.
So basically a forcast monday is the avg value of previous 4 mondays, tuesday same thing avg of 4 previous tuesdays, ect until i reach months end., of course next week will be based on previous projected(forecast) value that is taken in the AVG calulation.
any good tips?
- Mark as New
- Bookmark
- Subscribe
- Mute
- Subscribe to RSS Feed
- Permalink
- Report Inappropriate Content
Hi , i went with a data model solution that avoids complicated expressions in the chart.
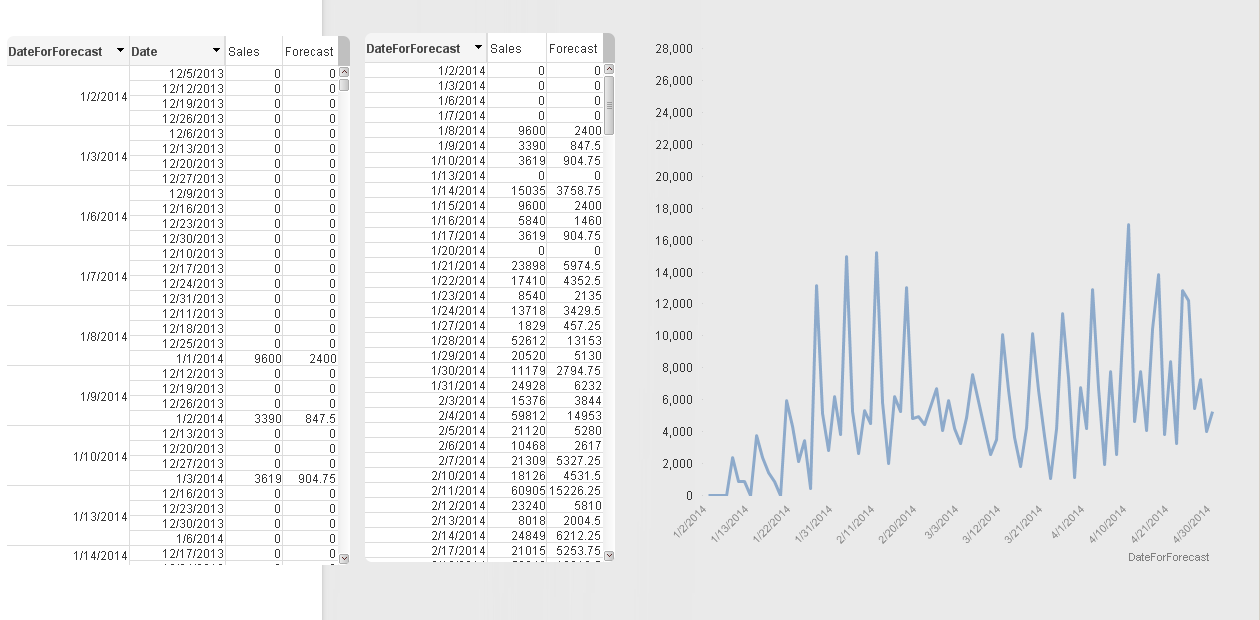
The solution is to build a table with 'blocks' of 4 records for each date. The 4 records store the date from 7,14,21, and 28 days ago. So in the table each date is associated with these 4 previous dates. The 4 previous dates link up to the main table (which also has date). That makes it super easy to create an average of the 4 previous dates for each date.
I dynamically created this table bu autogenerating all the records between the min and max date in the date model and pivoting it to the 2 column structure that i need.
In the chart on the left, i included the 4 previous dates so you can see the sums and averages. The middle is the same chart minus the 4 previous dates (just showing forecast). The chart on the right is the same as the middle just as a line .
Let me know if you have any questions.

- Mark as New
- Bookmark
- Subscribe
- Mute
- Subscribe to RSS Feed
- Permalink
- Report Inappropriate Content
hmm,. think I got it, however, it calculates avg for even values that i have already sales on, on the date i want sales on i do not get the real sales value. and the AVG is an AVG even on the dates i already have values on, so the projection gets me a avg based on AVG values on dates i already have a fixed sales value. gets even more odd when i add another dimension in, like area.