Unlock a world of possibilities! Login now and discover the exclusive benefits awaiting you.
- Qlik Community
- :
- All Forums
- :
- QlikView App Dev
- :
- Re: gauge chart color change
- Subscribe to RSS Feed
- Mark Topic as New
- Mark Topic as Read
- Float this Topic for Current User
- Bookmark
- Subscribe
- Mute
- Printer Friendly Page
- Mark as New
- Bookmark
- Subscribe
- Mute
- Subscribe to RSS Feed
- Permalink
- Report Inappropriate Content
gauge chart color change
hi
i am trying to display a gauge chart as shown in the image.
the problem i have is i want the colors to change when the conditions are like this
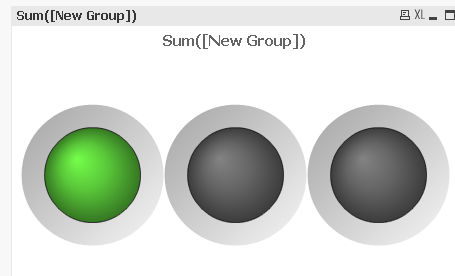 100-25 -> green
24- 1 -> amber
0= red
can some one plz help me with this plzzz...
would really appreciate the help alot
thank you in advance
Accepted Solutions
- Mark as New
- Bookmark
- Subscribe
- Mute
- Subscribe to RSS Feed
- Permalink
- Report Inappropriate Content
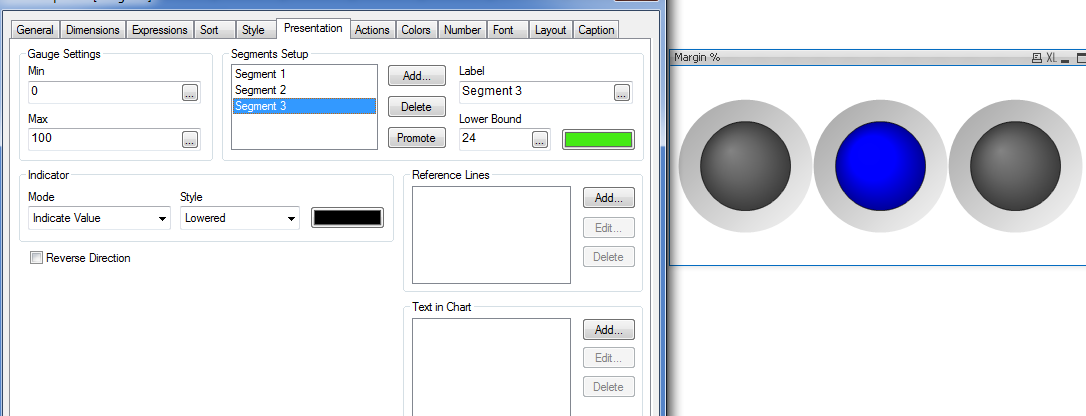
Chart properties , presentation tab.
add 3 segments.
Segment 1 add value 0, and select color red
Segment 2 add value 1, and select color blue
Segment 3 add value 24, and select color green..
and in min value box add min value 1, and max value 100.
see in the image.. if not able to do, share your document, i will do it...
- Mark as New
- Bookmark
- Subscribe
- Mute
- Subscribe to RSS Feed
- Permalink
- Report Inappropriate Content
See Attached Sample
Hope it Helps
Kind Regards
Khan