Unlock a world of possibilities! Login now and discover the exclusive benefits awaiting you.
- Qlik Community
- :
- All Forums
- :
- QlikView App Dev
- :
- how to Calculat Top 3 Value?
- Subscribe to RSS Feed
- Mark Topic as New
- Mark Topic as Read
- Float this Topic for Current User
- Bookmark
- Subscribe
- Mute
- Printer Friendly Page
- Mark as New
- Bookmark
- Subscribe
- Mute
- Subscribe to RSS Feed
- Permalink
- Report Inappropriate Content
how to Calculat Top 3 Value?
Hi Community,
I have below data -:
e.g.
Segment Customer id Value
A 1 10
2 11
3 12
4 20
5 23
B 6 20
7 30
8 50
9 60
10 40
C 11 10
12 50
13 40
14 30
15 20
now i want top 3 value of each segment, so how i calculate Top 3 value for each segment?
my expecated answer is -:
Segment Customer id Value
A 5 23
4 20
3 12
2 11
1 10
B 9 60
8 50
10 40
7 30
6 20
C 12 50
13 40
14 30
15 20
11 10
Thanks in advance.
Accepted Solutions
- Mark as New
- Bookmark
- Subscribe
- Mute
- Subscribe to RSS Feed
- Permalink
- Report Inappropriate Content
Hi Ishwar,
There are many ways to achieve this one of this simple way.
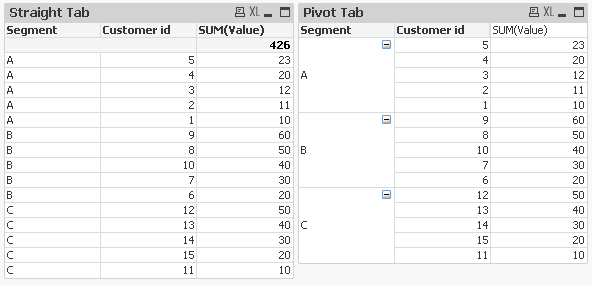
Take straight or pivot chart
Dim1:-Segment
Dim2:- Customer id
Expression:- Sum(Value)
And in the Sort tab remove all selection but for Customer id select expression and write

And then you get chart like below and sorted order also

Also maintain priority order like in the sort properties

Regards
Anand
- Mark as New
- Bookmark
- Subscribe
- Mute
- Subscribe to RSS Feed
- Permalink
- Report Inappropriate Content
hi
try some thing like below
if(aggr(rank(sum(value)),segment)=3,value)
- Mark as New
- Bookmark
- Subscribe
- Mute
- Subscribe to RSS Feed
- Permalink
- Report Inappropriate Content
try like this
firstsortedvalue(segment,-customerid)
or
if(aggr(rank(sum(value),segment))<=3,customerid)
- Mark as New
- Bookmark
- Subscribe
- Mute
- Subscribe to RSS Feed
- Permalink
- Report Inappropriate Content
try in dimension limit top3 putting segment and cust id in dimension
- Mark as New
- Bookmark
- Subscribe
- Mute
- Subscribe to RSS Feed
- Permalink
- Report Inappropriate Content
on a Straight Table Chart, you can use Segment and Customer ID as Dimensions,
On Dimension Limit Property, set Limit for Customer ID, "show only" Largest 4.
this way you show top 3 customer id for each segment
- Mark as New
- Bookmark
- Subscribe
- Mute
- Subscribe to RSS Feed
- Permalink
- Report Inappropriate Content

- Mark as New
- Bookmark
- Subscribe
- Mute
- Subscribe to RSS Feed
- Permalink
- Report Inappropriate Content
 Hi
Hi
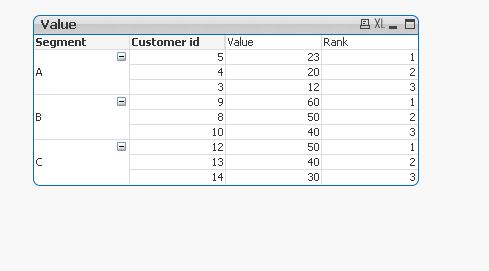
there is the complete solution, where you only see the ranking from 1 to 3 for every segement.
regards Martin
- Mark as New
- Bookmark
- Subscribe
- Mute
- Subscribe to RSS Feed
- Permalink
- Report Inappropriate Content
Hi Ishwar,
There are many ways to achieve this one of this simple way.
Take straight or pivot chart
Dim1:-Segment
Dim2:- Customer id
Expression:- Sum(Value)
And in the Sort tab remove all selection but for Customer id select expression and write

And then you get chart like below and sorted order also

Also maintain priority order like in the sort properties

Regards
Anand
- Mark as New
- Bookmark
- Subscribe
- Mute
- Subscribe to RSS Feed
- Permalink
- Report Inappropriate Content
Thanks to all of you for your quik reply.