Unlock a world of possibilities! Login now and discover the exclusive benefits awaiting you.
- Qlik Community
- :
- All Forums
- :
- QlikView App Dev
- :
- Re: how to pile bars in a barchart?
- Subscribe to RSS Feed
- Mark Topic as New
- Mark Topic as Read
- Float this Topic for Current User
- Bookmark
- Subscribe
- Mute
- Printer Friendly Page
- Mark as New
- Bookmark
- Subscribe
- Mute
- Subscribe to RSS Feed
- Permalink
- Report Inappropriate Content
how to pile bars in a barchart?
Hello Community,
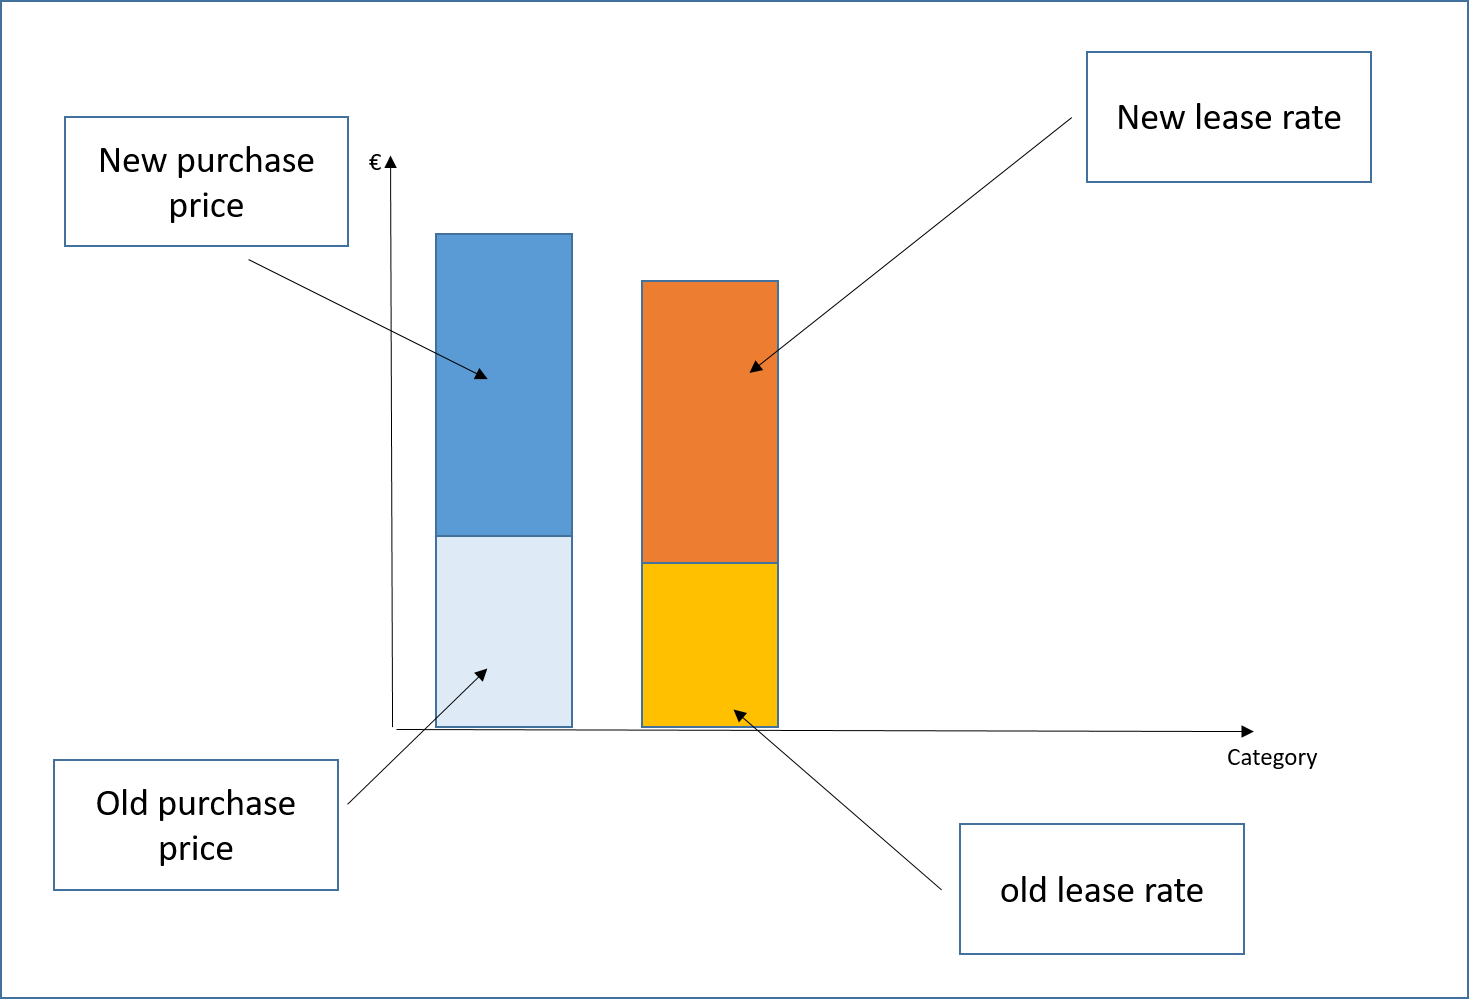
I wanna pile the new purchase price on the old purchase price and the new leaserate on the old leaserate in a barchart.
I have 5 variables:
| Variables | Value |
|---|---|
| Purchase Price old | 100000 € |
| Purchase Price new | 300000 € |
| Leaserate old | 3500 € |
| Leaserate new | 12000 € |
| Expected Useful Life in months | 24 |
I chosed an independent Dimension (Category) which has no relation to the purchase price or leaserates
I created 4 different expressions in one chart
Expected Useful Life = 24 months
| Purchase Price old | Purchase Price new | Leaserate old | Leaserate new |
|---|---|---|---|
| 100000 € | 300000 € | 3500*24 = 84000 | 12000*24 = 288000 |
Purchase Price TOTAL: -> [Purchase Price old]+[Purchase Price new] -> 100000+300000 = 400000
Lease TOTAL: -> [Leaserate old]*[Expected Useful Life]+[Leaserate new]*[Expected Useful Life] -> 3500*24+12000*24 = 372000
This is how it should look like
I hope anyone can help me out here
- Mark as New
- Bookmark
- Subscribe
- Mute
- Subscribe to RSS Feed
- Permalink
- Report Inappropriate Content
Hi,
Why dont you split in to two different chars ? any issue
Chart 1:
Dim Catgeory,
Exp1: OldPurchase
Exp2: New Purhcase
Chart2:
DIm:Category
Exp1:Old less rate
Exp2: New Less rate
Make the bar chart style Mode as Stacked.
- Mark as New
- Bookmark
- Subscribe
- Mute
- Subscribe to RSS Feed
- Permalink
- Report Inappropriate Content
I need it in one chart , to compare that leasing is cheaper than purchase
- Mark as New
- Bookmark
- Subscribe
- Mute
- Subscribe to RSS Feed
- Permalink
- Report Inappropriate Content
Hi,
Is this helping you?
Dim Catgeory,
Exp1: sum(OldPurchase)
Exp2: sum(New Purhcase) (and at BAR Offset sum(OldPurchase))
Exp3:sum(Old less rate)
Exp4: sum(New Less rate) (and at BAR Offset sum(New Less rate))
You can find bar offset on the plus, when expending the expression option.
Best regards,
Cosmina
- Mark as New
- Bookmark
- Subscribe
- Mute
- Subscribe to RSS Feed
- Permalink
- Report Inappropriate Content
Hi Popescu,
unfortunetely is is not workin properly. The bar below disappears and it doesnt show the total sum of both values.